Two New Academic Papers

If you’ve been to my hands-on workshops, you might be surprised to hear I’m also the “academic paper” kind of guy.  In fact, my position here as Research Scientist at the MIT Media Lab means that one of the way I contribute is by publishing academic papers.  I have two of those in the latest issue of the International Journal of Community Informatics, a special edition on Data Literacy.  Give them a read if you want a deeper look into either how our Data Murals work, or into the design and use of our DataBasic.io suite of activities and tools.

Special_Issue_on_Data_Literacy___Vol_12__No_3__2016____The_Journal_of_Community_Informatics.png

Data Murals: Using the Arts to Build Data Literacy

Rahul Bhargava, Ricardo Kadouaki, Emily Bhargava, Guilherme Castro, Catherine D’Ignazio

Current efforts to build data literacy focus on technology-centered approaches, overlooking creative non-digital opportunities. This case study is an example of how to implement a Popular Education-inspired approach to building participatory and impactful data literacy using a set of visual arts activities with students at an alternative school in Belo Horizonte, Brazil.  As a result of the project data literacy among participants increased, and the project initiated a sustained interest within the school community in using data to tell stories and create social change.

DataBasic: Design Principles, Tools and Activities for Data Literacy Learners

Catherine D’Ignazio, Rahul Bhargava

The growing number of tools for data novices are not designed with the goal of learning in mind. This paper proposes a set of pedagogical design principles for tool development to support data literacy learners.  We document their use in the creation of three digital tools and activities that help learners build data literacy, showing design decisions driven by our pedagogy. Sketches students created during the activities reflect their adeptness with key data literacy skills. Based on early results, we suggest that tool designers and educators should orient their work from the outset around strong pedagogical principles.


Talk Video: Data Analysis as Civic Engagement

Here’ s a video of a short talk I gave recently at the Harvard Data Across Scales conference.  As part of their Open Data and Civic Media panel, I spoke about Data Analysis as Civic Engagement.

The abstract and talk were written by Emily and myself:

Increasingly, open data efforts and data-driven decision making processes have created a power disparity between those that “speak data” and those that do not. While data-driven public policy decisions can increase the impact and efficacy of interventions, they leave many community members out of conversations and out of decision-making processes. In this session we will present case studies of the collaborative arts-based techniques the Connection Lab and the MIT Center for Civic Media have developed to bring these conversations back into the public sphere. These hands-on activities prepare community members without a background in data analysis to participate actively in the creation and public presentation of data-driven messaging. This offers a new model for civic engagement, bringing people together around data to create public interventions that alter the urban sphere, creating audience-appropriate messaging and increasing the data literacy of participants.

The Data Storytelling Studio

I’ve been radio silent for the last half year for two reasons.  Firstly, we had a new baby!  Secondly, I’ve been planning and am now teaching a semester long course at MIT for undergraduates and graduate students.  I’ve called this course the Data Storytelling Studio.  You can follow the course blog at http://cms631.datatherapy.org.  I’ll continue to blog here, but less frequently this semester.

I prefer not to share cute baby pictures online, but am happy to share pictures from the course!  I’ve sketched it out with my colleague Catherine D’Ignazio, assistant professor at Emerson college.  She is teaching a version tailored for journalists there, while I teach a diverse audience of MIT students (the course is offered by the Comparitive Media Studies / Writing program).  The course isn’t a programming or data science course; the focus is more on process, tools, and creative presentation.

I’ll be leading the students through an arc of five modules:

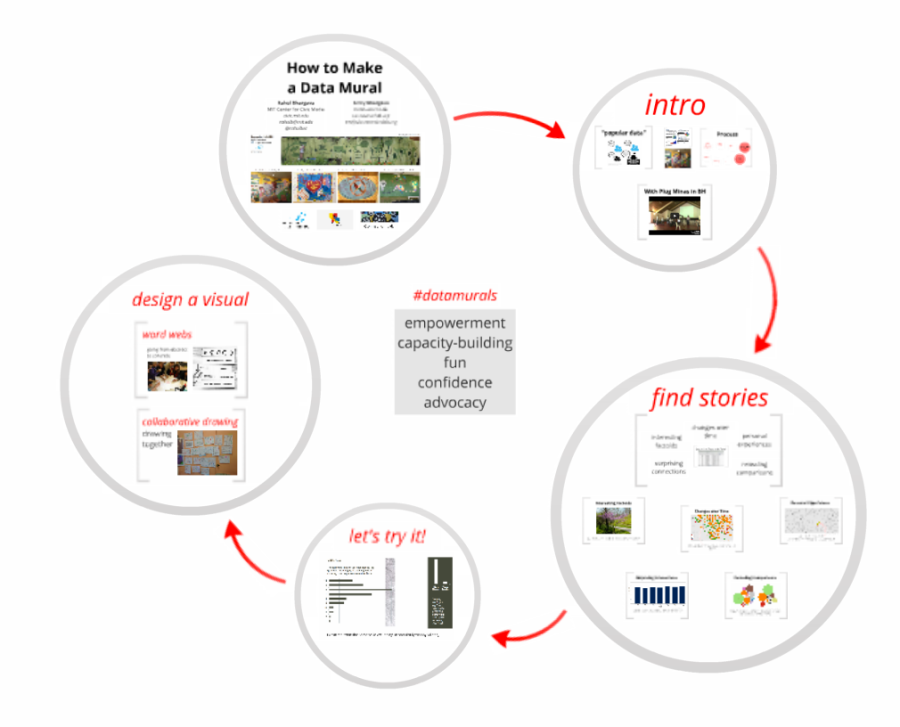
  1. Introduction – we begin by setting context and designing and painting a Data Mural together
  2. Finding and Analyzing Data
  3. Cleaning Data and Finding Stories
  4. Presenting Your Story
  5. Final Project

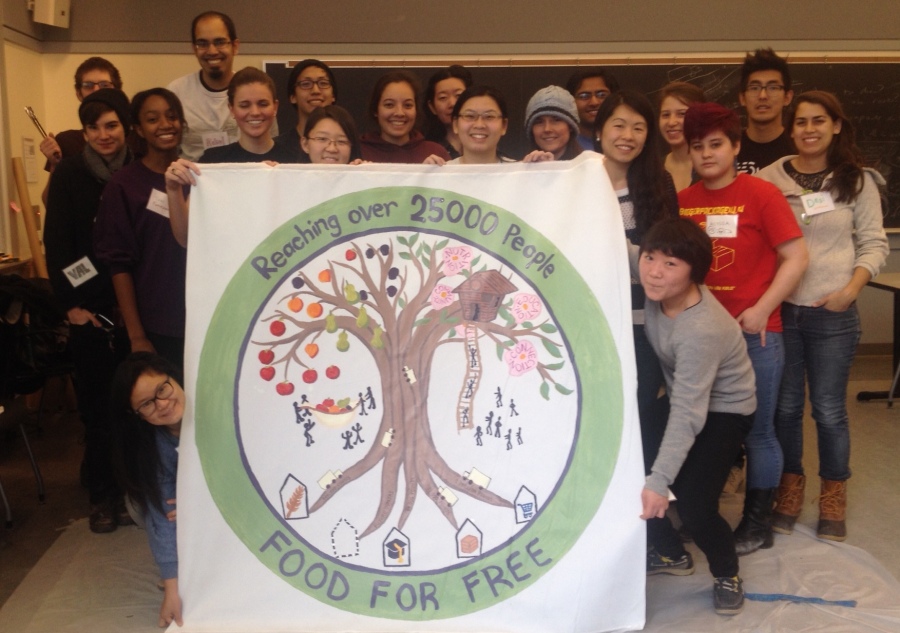
I’ve focused on the topic of food security for this semester, so most of the projects and assignments will focus on that.  In fact, our mural tells a story about Food For Free, a local organization that runs food rescue and other programming.  As you can see, we’re off to a great start!

IMG_6189

Lasers, Food & Data (Telling a Story About Food Security)

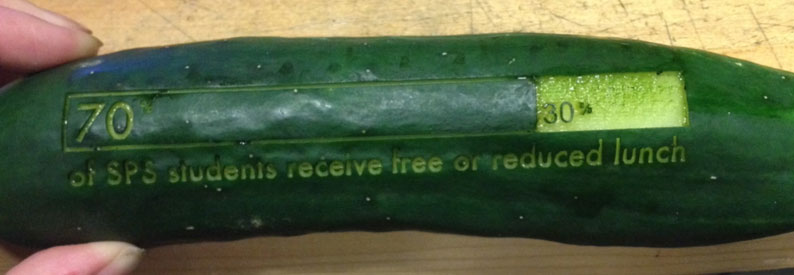
Can a vegetable tell a story about food access in Somerville?  Yep.

"70% of Somerville Public School students receive free or reduced lunch" - laser-cut onto a cucumber
“70% of Somerville Public School students receive free or reduced lunch” – laser-cut onto a cucumber

In public settings, it can be quite hard to get folks walking by interested in a data-driven argument about your cause.  We often argue that a creative data sculpture can grab their attention… like maybe a vegetable laser cut with some data about food security!

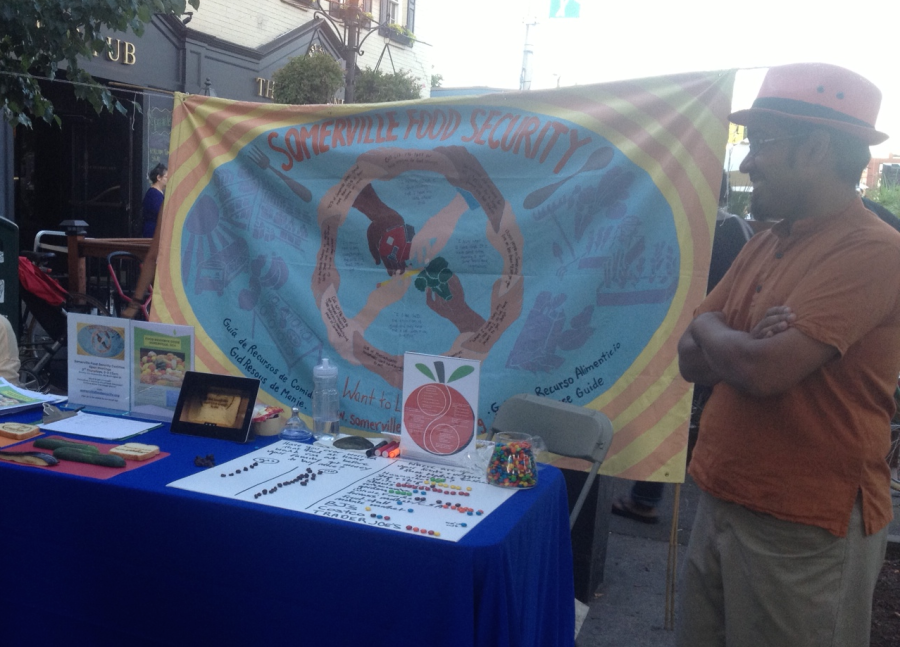
We’ve worked with the Somerville Food Security Coalition a few times, including for our first data mural pilot project!  Recently, we had a chance to come together again around their local data about food security at the Somerville Arts Council’s 2014 Ignite Festival.  The festival celebrates fire and food, which inspired us to laser cut some data onto food and see how people reacted!

ignite-food-data-table

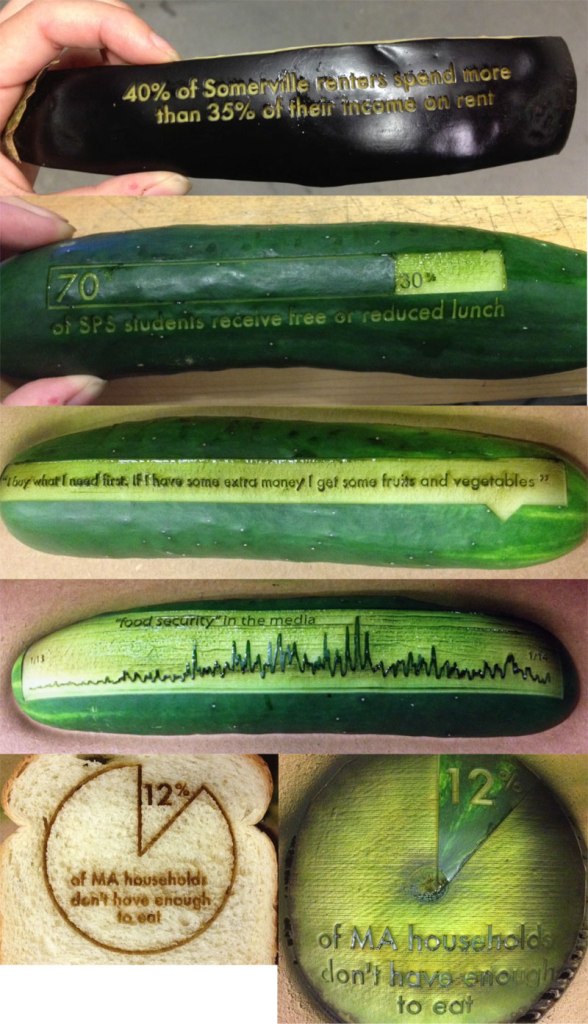
Here’s all the veggies we cut – eggplant, cucumber, zucchini, bread, and watermelon:

laser-cut-veggies

In addition, we prompted folks to interact with two questions – both of which they could answer with M&Ms and raisins.  Asking folks to take an M&M survey is a highly effective way to get them to interact with their data!

https://twitter.com/rahulbot/status/498880294226001920

https://twitter.com/rahulbot/status/498883181714882560

Here’s a behind-the-scenes video showing the laser cutter in action:

This is cross-posted to the Civic Media blog.

Bringing Together Street Art and Data

We were recently awarded a Making All Voices Count grant with our friends at the Mtaani Initiative and Radar, focused on creative communication in Nairobi’s slums – we’re calling the initiative Sauti Ya Mtaa.

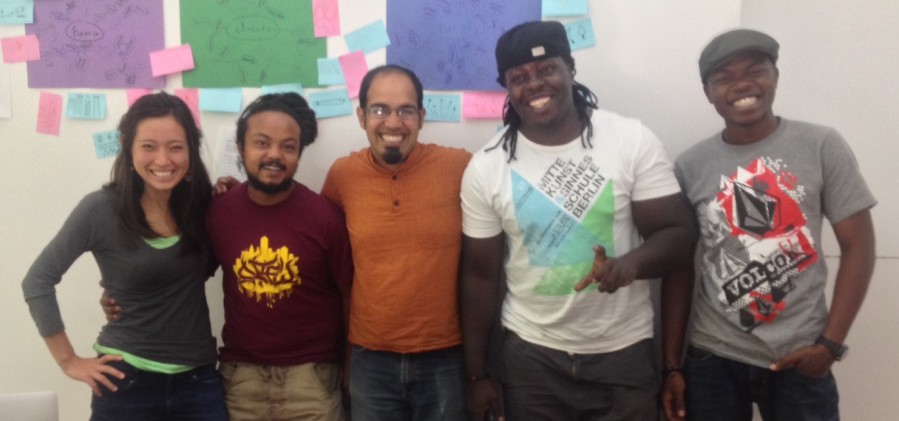
I strongly believe that data-driven advocacy is a great way to bring about change.  However, you have to find the right story to tell and the technique to tell it.  We’ve trying murals as a new way to tell data-driven stories, but none of our pilot projects worked with professional artists.  Street artists know the context and messages that will work in their community.  That’s why we’re so excited to have kicked off our collaboration with graffiti artists in Nairobi!  Over the next year we’re going to work together to develop local capacity to do innovative creative messaging to catalyze change in their communities.photo 4Sasha, Uhuru, Me, BankSlave and Swift9 met up in Berlin for 2 days for our first training (before the OKFest started).  Our goals included:

  • me learning how they work
  • them learning some of our facilitation techniques
  • designing a data mural to paint in Nairobi
  • planning the next steps in Nairobi

Training

We had a packed agenda over the two days!  We started off getting to know each other a little bit, and exploring some inspirational examples, including our data murals. http://www.pinterest.com/rahulbot/street-art-data-murals/ We kicked off our building exercises by running the data sculptures activity.  The artists liked the materials involved and thought people would respond to how playful it was. Next I introduced our story types and some data on education and employment from the Nairobi budget and SID report for Nairobi County (1).  We all looked for stories of different types.  The artists found the story type templates helpful, but struggled with the idea of saying something in the data was either a “factoid”, a “comparison” or something else.  This raised the great point of how we can get lost in the activities sometimes, stuck on trying to do them “correctly”, when in fact it didn’t matter exactly which type of story it was.  One artists said:

filling in a factoid story form appeared challenging at first but eventually after a while it proved to be a vital part in this whole process

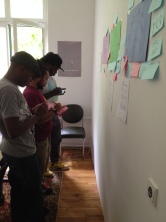
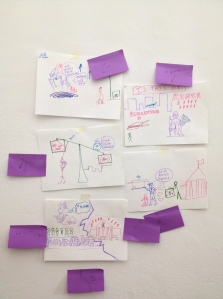
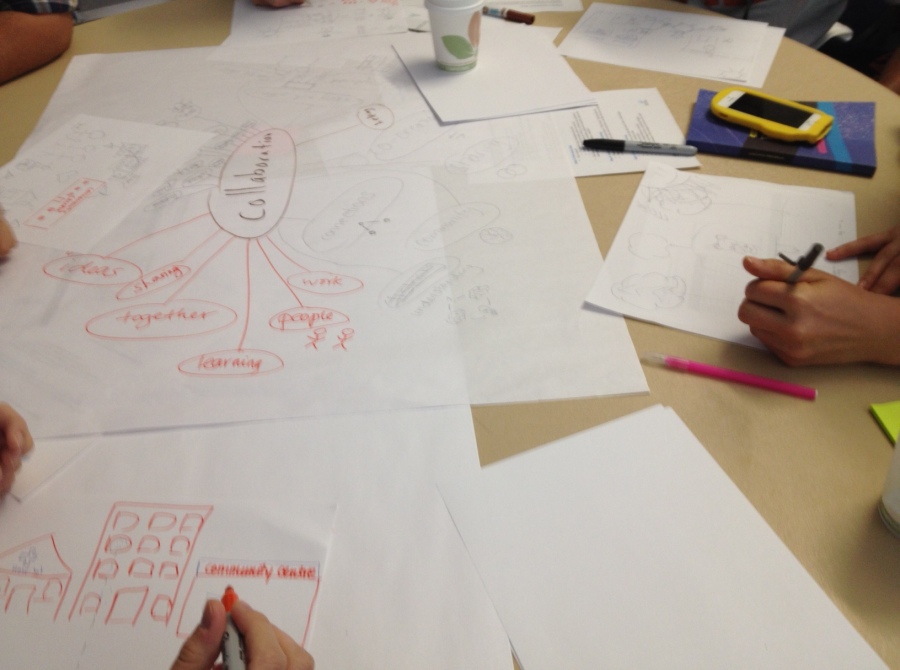
Once we had a number of stories, we pulled some abstract ideas from them – “education”, “finance” and “rural”.  We did some word webs for these words together, to try and concretize them.  We put these on the wall, grabbed stickies, and drew any of the words that could be drawn.

photo 1   photo 2

The artists loved this activity, and immediately thought of ways it could be relevant for their workshops.  This process of coming up with symbols to represent abstract ideas fits well into past work in Nairobi (see the Vulture murals, for instance). One artist said:

this approach is fun and should be used all the time

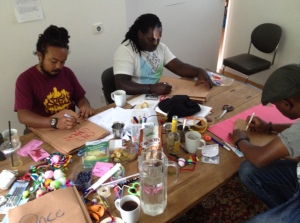
With these words and the data stories in mind, we took some time to focus on visual narrative.  First we created storybooks to tell the data stories. The artists spent a little more time than I had hoped writing out their stories – I introduced it poorly and they had great feedback for how to present it as a comic book next time I try it:

Story Boooks are fun, but we could make it more interactive as a comic book set up rather than what I did (more writing and less illustrations)

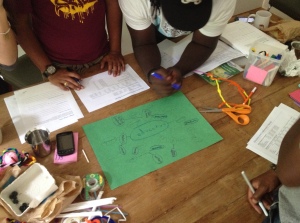
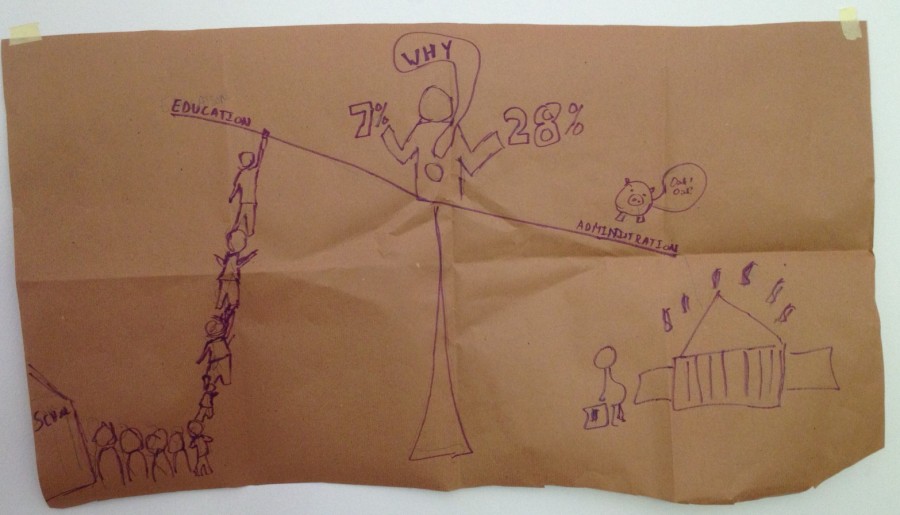
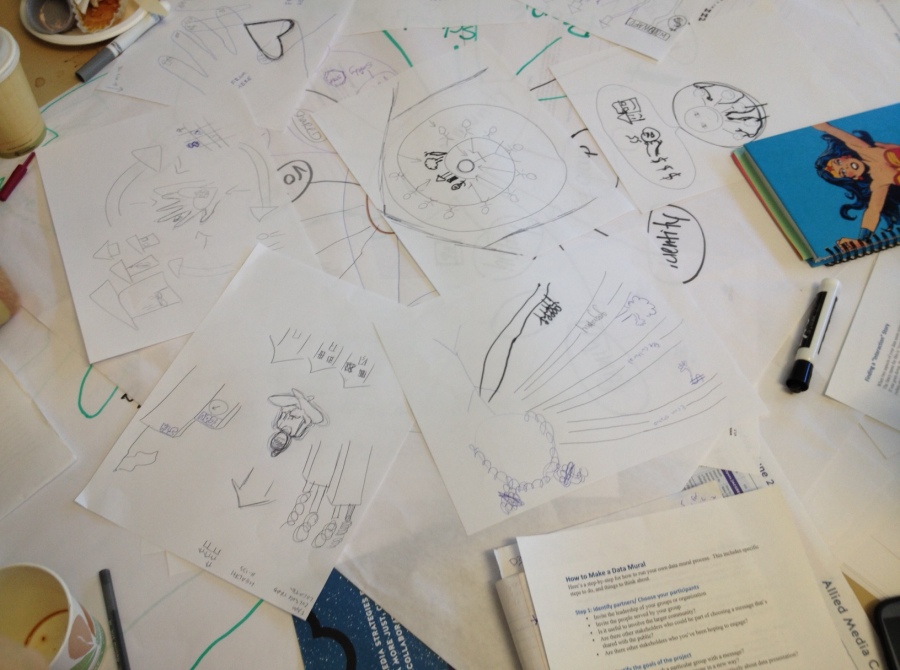
photo 3To wrap up the design exercises did a pass around drawing for one story they liked most – about the relatively low percentage of budget funding going towards education.   One artists said:

the pass around drawing was fun and creative teamwork and saving on time to come up with a concrete concept which usually consumes more time

Another said:

it was fun and got everyone to participate

This led to a small set of drawings that all told the same story.photo 5I facilitated a discussion about what elements of the design they liked most, and exercised a little editorial control to generate a sketch of a mural to paint!mural designAfter all this we took a step back and discussed work the artists have done, and issues they cared about.  This led to a good conversation about how all the activities felt, how the might fit into work the context in Nairobi. One artists said:

What really got my attention was the structure and approach in general as a session

Next Steps

To close out the packed schedule, we squeezed in a discussion of next steps on the grant.  We plan to continue to converse via WhatsApp, and to set up monthly Skype checkins.  These channels for communication will feed activities over the next few months.

Notes:

(1) We used the Nairobi Full Budget FY 2013-2014 (online at the International Budget Partnership) and the 2009 SID report for Nairobi County.

Speaking Data

Here’s video and a writeup of a short 5 minute talk I gave recently at the 2014 Civic Media Conference.  I attempt to tease apart my definition of “popular data” by comparing it to the concept of “data literacy”.

Do you “speak data”?  As more and more businesses and governments are making data-driven decisions, this question is becoming more important.  Your ability to speak data is directly related to your ability to engage with those institutions.  For governments this is a critical issue because they are meant to engage the citizenry.
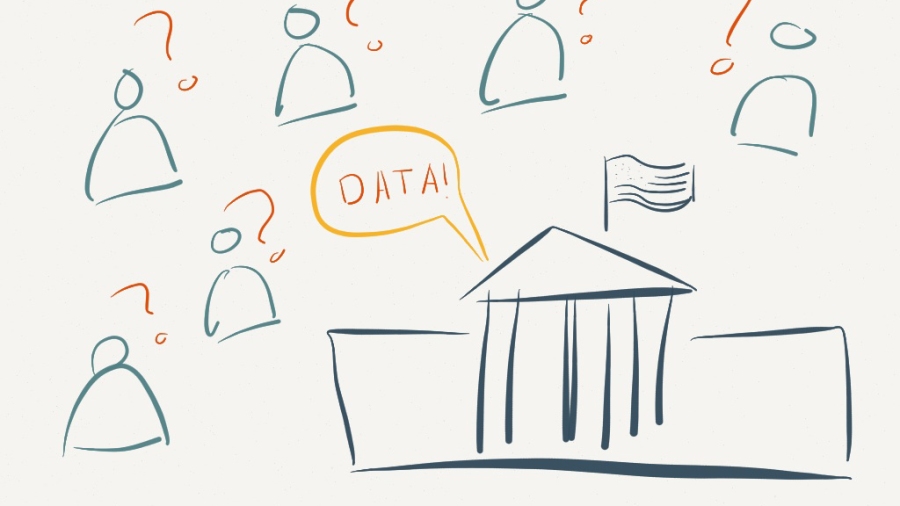
image 2

Most folks try to address this, talking about it as “data literacy”, but that doesn’t quite capture the whole idea.  The concept of “literacy” suggests a spectrum:

  1. the illiterate: those that can’t participate in written discussion
  2. the readers: those that can take in the ideas of others who have written them
  3. the writers: those who can capture their ideas on paper


The idea of literacy is to move people from illiterate to reading, but the writers are those in control.  The writers are those with the power.  With data, we need to make more readers for sure.  However, the bigger issue is that we can’t just focus on readers when actually we need better writers.  This is the piece I see missing from the data literacy work misses.

So who are the existing data writers?  Newspapers, community groups, governments, businesses – they all generate data-driven stories for the readers.  So how do we make those passive readers into data writers?  Well, my studies in the Lifelong Kindergarten Group point me back to Paulo Freire, the Brazilian philosopher and educator.
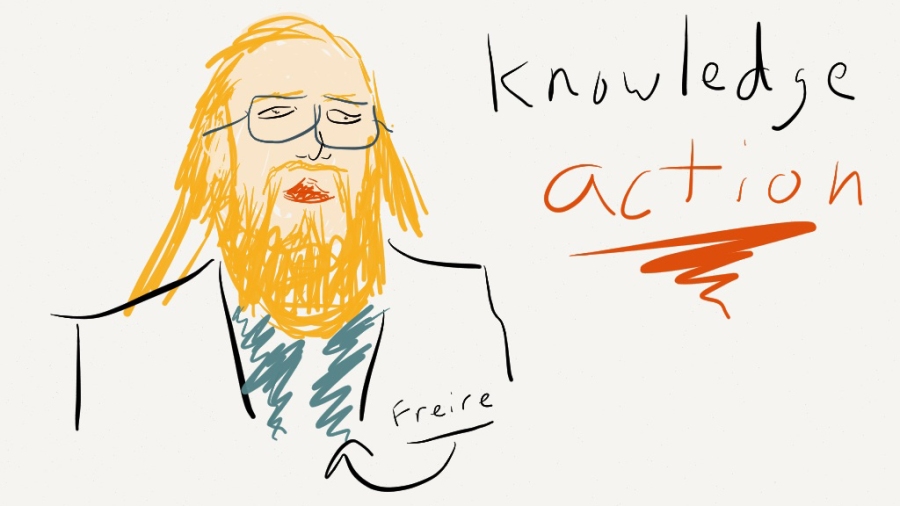
image 5

Freire’s concept of popular education stemmed from his early work on adult literacy, where he focused on learning literary skills by reading local newspapers.  The ideas was that the content and context would empower the learners.

There are a few tactics of popular education that are key:

  • you must value what each individual brings to the table as a unique and meaningful addition
  • the teacher/educator is more of a facilitator for the learners
  • thought most be combined directly with action
  • the action must be tied to local community needs

So combine these tenants with the basics of data literacy and you get my new concept of popular data.  Whats the difference? Data literacy is about the what.  Popular data is about the why. 
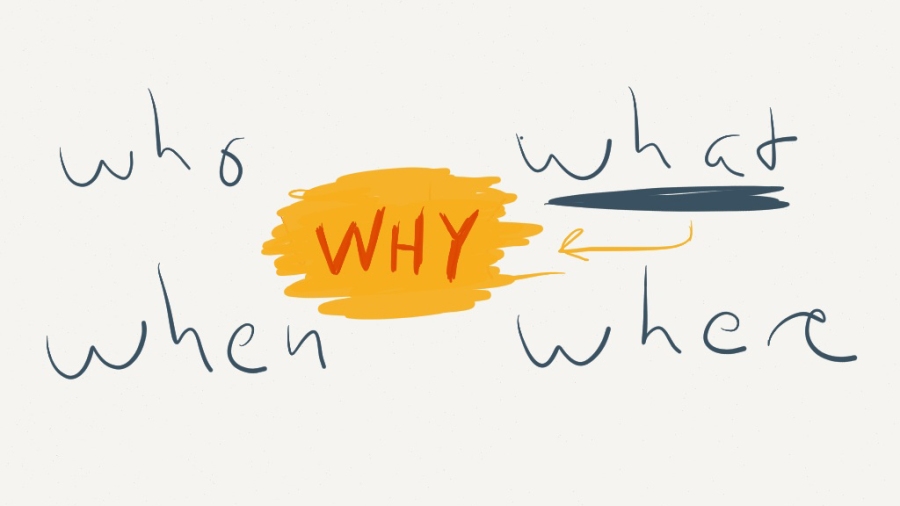
image 14

That’s all really abstract.  Lets run through some examples of how this works in the real works.

Newspapers

Newspapers have always played a critical role informing the public.  They’ve moved this into the data-driven era by way of things like the Data Driven Journalism Handbook and numerous trainings to help journalists find and tell stories with data.  Similarly, they are experimenting with new interactive ways to write exploratory and explanatory data-driven articles.

Governments

Our partners in the state government of Minas Gerais, Brazil realized that an open data portal was the start, not the end, of their open data initiatives.  They brought us down to do a series of lectures, workshops, and a data mural that tried to build local capacity to work with that data to advocate for change.  This was about turning those readers into  writers.  I argue governments, as they embrace more data-driven policy, have a moral duty to help their constituency speak data.

Community Groups

These folks could be aptly-described as semi-literate.  All Data Therapy workshops aim to build their capacity to present data in more creative and appropriate ways.  This is about making them better writers.

Regular Folks

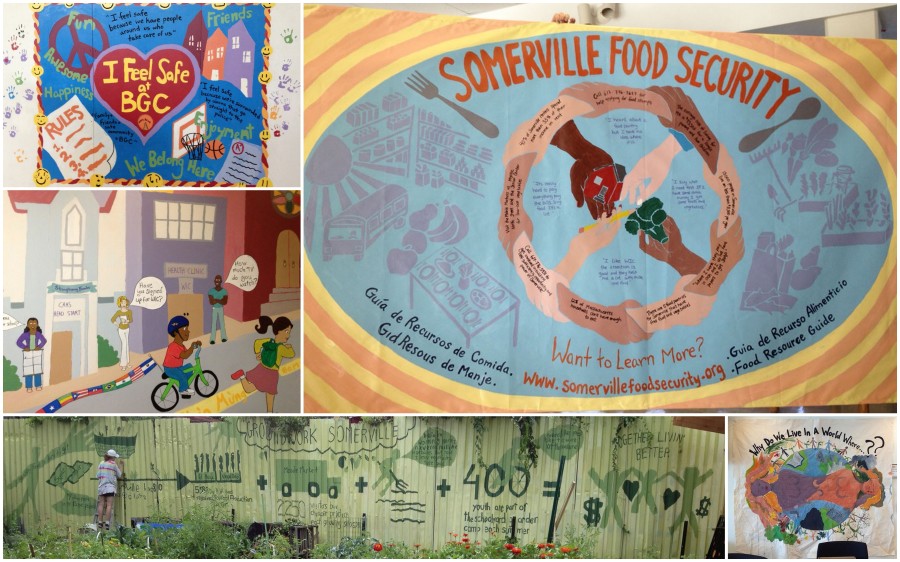
These are the “illiterate”, to a certain extent.  To help them become readers and writers, we created the Data Murals project.  We want to use the engaging power of the arts to invite them to learn to speak data.  This involves creating participatory workshops to engage them when looking at data to find a story, and then collaboratively designing a visual to tell that story, and then paint it as a mural.  This is an empowerment effort.

These are some key examples of what popular data means in practice, and why it is important to go beyond the concept of “data literacy”.

Data Murals @ Allied Media 2014

We just completed a short workshop for attendees at the 2014 Allied Media Conference in Detroit.  The attendees were mostly community activists and organizers with loads of experience, so we got some great questions about how to facilitate the activities we do.  This was our second training for trainers, and we’re hoping the participants create some neat projects with their communties!

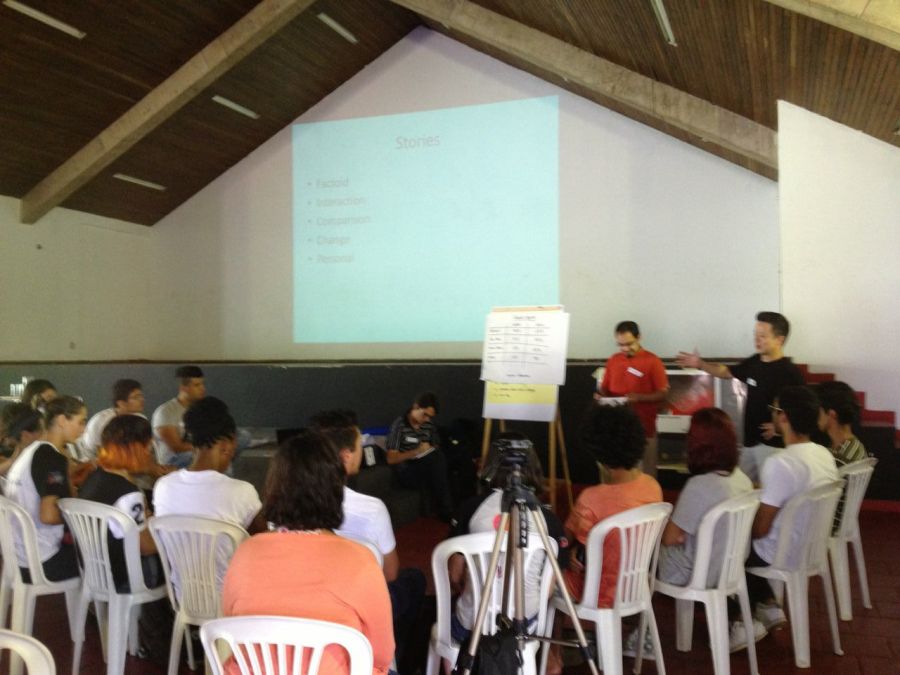
We introduced the goals and process we use, and then led folks through our story finding activity, word webs, and collaborative drawing activities.  It was a whirlwind hour and half, but we felt like doing a little bit of each step was the right thing for this audience.

photo 1 photo 2

Here’s the presentation we gave:

AMC

And here are the handouts:

A Data Mural in Brazil!

I just returned from a fascinating week in Belo Horizonte (Brazil), where we ran multiple workshops to build capacity to work with data in creative ways.  The trip was organized by the Office of Strategic Priorities of the State of Minas Gerais (they are members of the MIT Media Lab).  This post is one in a series about the workshops we ran there.

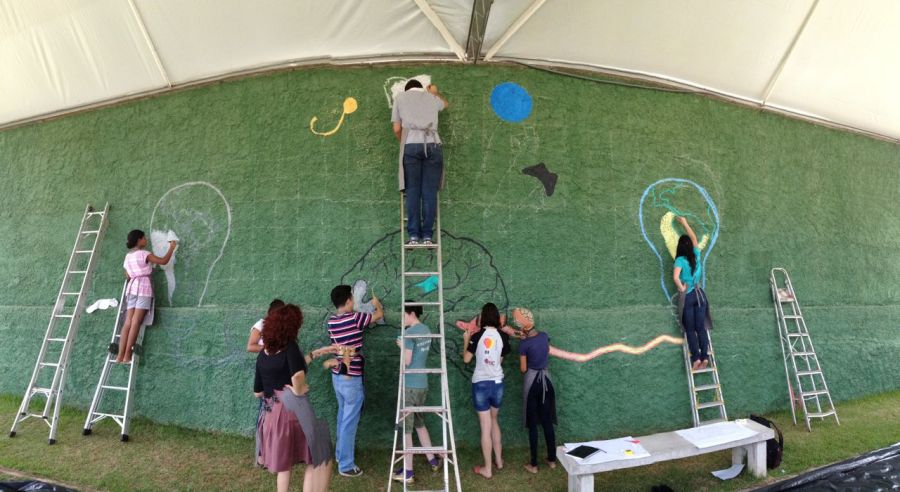
The most fun we had on our trip was designing and painting a Data Mural with students at the Plug Minas school.  This was a our standard Data Mural workshops process, compressed into just two days (including painting!).  We worked with about 15 amazing students for the design session, and then had over 50 people help during the painting day.

Interested in making your own Data Mural? Here’s an outline of our process.

IMG_3132

Process

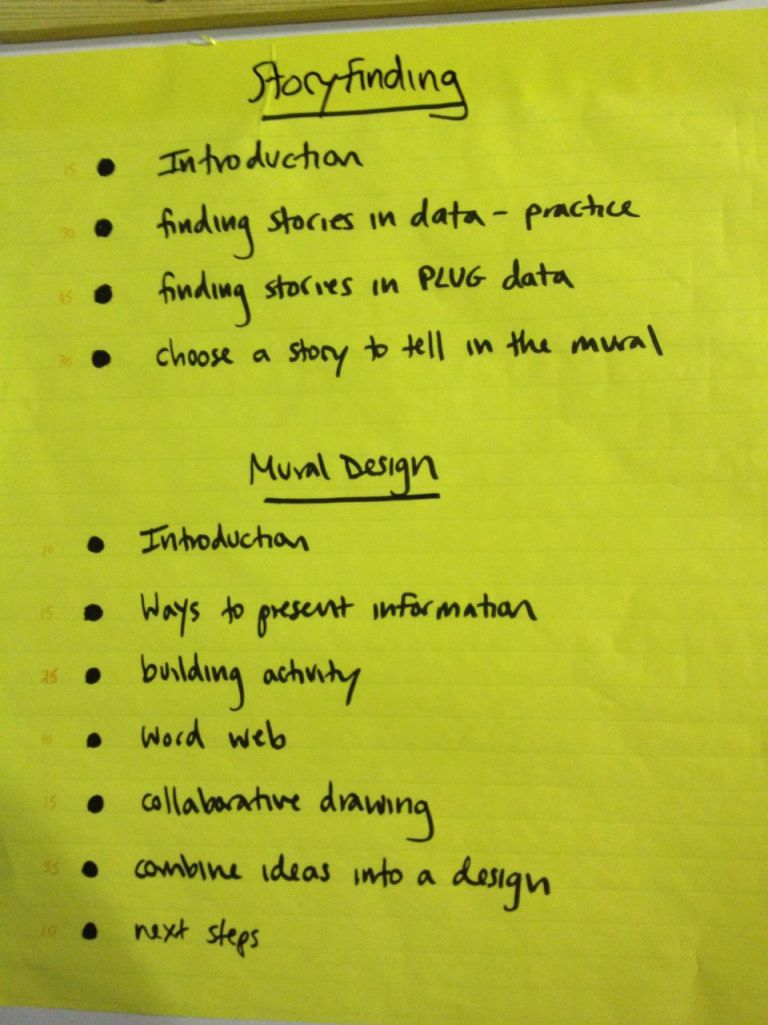
The first day we ran a story-finding workshop, and then a visual-design workshop.  The agenda were rushed, but covered all the topics we usually cover.  This was, of course, another chance to try out some new facilitation and learning techniques.

IMG_3245

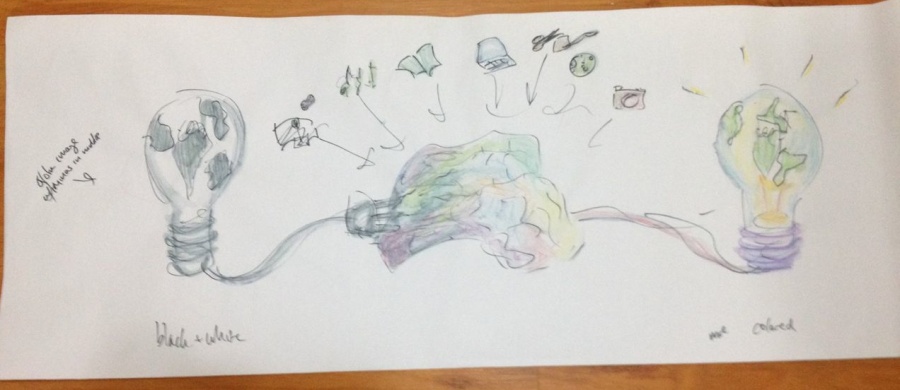
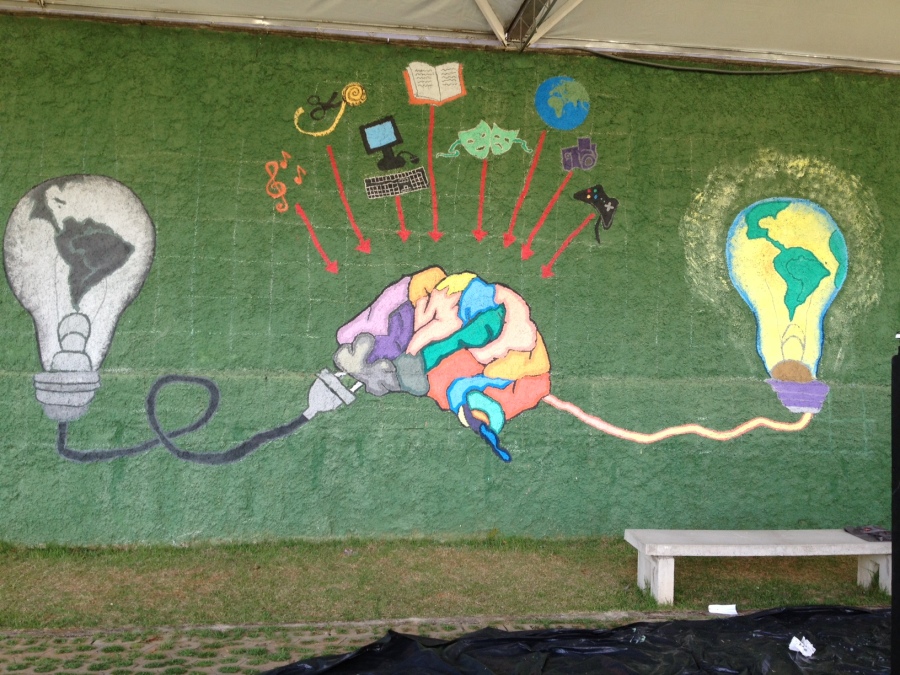
We started with a bunch of data about the school, enrollment demographics, public perception of their programs, and student satisfaction survey data.  From that data, the story-finding workshop resulted in a story they wanted to tell about how students go through a process of transformation while at Plug Minas, and come out as better people.

IMG_3233

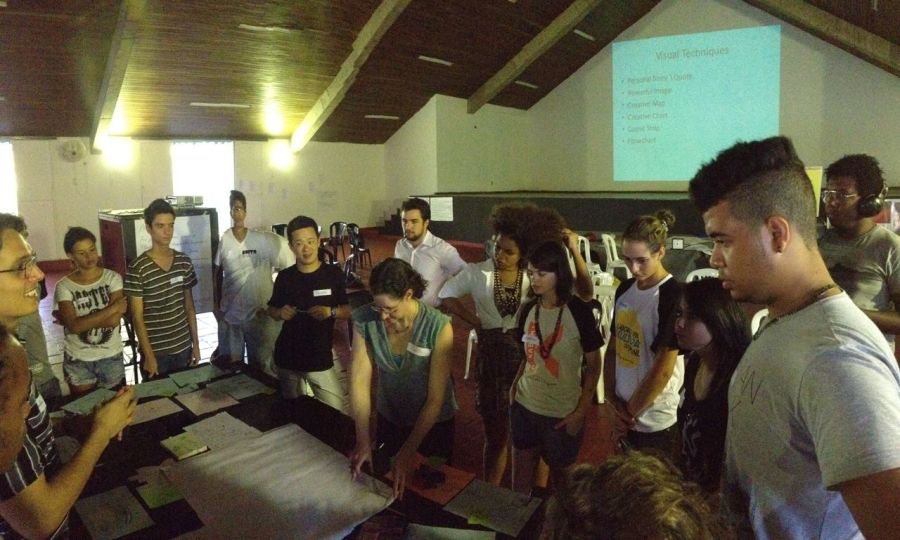
We then facilitated a variety of activities that helped them turn that story into a visual design for a mural!

design-sketch

And then we painted it!  The video they made (at the top of this post) is an amazing view into that chaotic process 🙂

IMG_3294


photo-2-1

Reflections

Plug Minas is made up of a number of “Nucleos” – centers that focus on individual topics.  Students tend to identify with these centers, rather than with Plug as a whole.  One of the goals of this mural was to try to tell the whole Plug story, and the design they came up with definitely does that.  The story of transformation has all the Nucleos feeding into the brain in harmony!

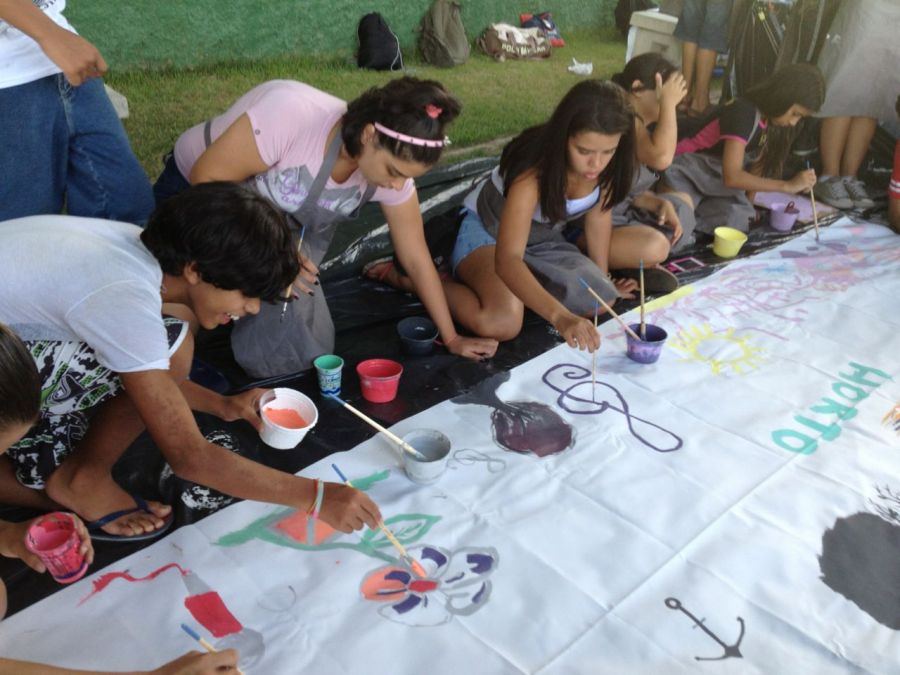
Another goal was to try and connect Plug more to the neighborhood it is in (Horto).  One amazing way they did this was to hire an announcement car to drive around inviting folks to participate (it’s in the video above).  We had a number of community members come help paint the mural, and as we finished we pulled out a big canvas to let others draw their thoughts about the neighborhood too!

IMG_3337

On a different note, language is hard.  We struggled to facilitate some of the more interactive conversations.  For instance, when narrowing down to one story, or combining ideas into one visual design.  Luckily, Emily’s 1 year of Portuguese training helped her a ton – so she led those sessions.  That said, it was still incredibly difficult to hear all the ideas and summarize connections back to the group.  Facilitation like this is difficult in English already!  Our collaborators, Ricardo and Guillerme, were AMAZING as translators.

Here’s Emily’s quick write up about the mural.  Plug posted some pictures too.

Focusing in on the Mural part of Data Murals

Last year we finished our Data Mural pilot projects, and have been very happy with how the evaluation has looked.  We’ve judged things against our logic model, to assess how we’re doing against our desired outcomes. One of the outcomes we listed was a “more beautiful community”.  Now, of course that is subjective, but if you look at the murals we painted I think most would say they are nice community art pieces.

pics

That said, we focused so much on the capacity building outcomes that we didn’t make time to innovate on the artistic output.

I’ve recently been wondering if we can bring some new technologies back into this in a useful way.  One idea was to explore conductive paints in the mural.  I think there’d some really cool interactions we could make to help tell the data story.  Bringing some of my museum exhibit design experience to bear in this space would be fun. Maybe by picking a handprint to touch on the mural you light up some part of the mural that applies to you?

I dug around and the best example I can find of using conductive paint in a mural is the Light of Human Kindness project (here’s a great video about it).  The community project collected stories of good deeds and built them into a mural and website.  The mural is on a big wall with tons of lights embedded in it, each representing a story.  When you submit a story online one of the lights blinks.  They added an interesting interaction around the idea of people holding hands in front of it.  If a lot of folks hold hands, with one person in the chain touching the mural, then the lights play a pattern.

Yes, it is a lightweight interaction, but it still carries that sense of magic.  I love that they linked the overall message of the mural with the interaction (ie. holding hands and helping each other).  I think it’s time to start doing some experiments here, because conductive paint feels like a way to innovate in support of the data story but still be true to the mural form.