You don’t need complicated software to learn how to work with data

Most data trainings are focused on computer-based tools. Excel tutorials, Tableau trainings, database intros – these all talk about working with data as a question of learning the right technology. I’m here to argue against that. Building your capacity to work with data can be done without becoming a “magician” in some software tool.

Data literacy is not the same as computer literacy. This is an important distinction, because there are lots of people that are intimidated by computer technologies; but many of them are otherwise ready and excited to work with data. In my workshops with non-profits I find that this technological focus excludes far too many people.  Defining data literacy in technological terms doesn’t welcome those people to learn.

To support this argument, let me start by describing what I mean by the skills needed to work with data. In my workshops we focuses on:

  • Asking good questions
  • Acquiring the right data to work with
  • Finding the data story you want to tell
  • Picking the right technique to tell that story
  • Trying it out to see if your audience understands your story

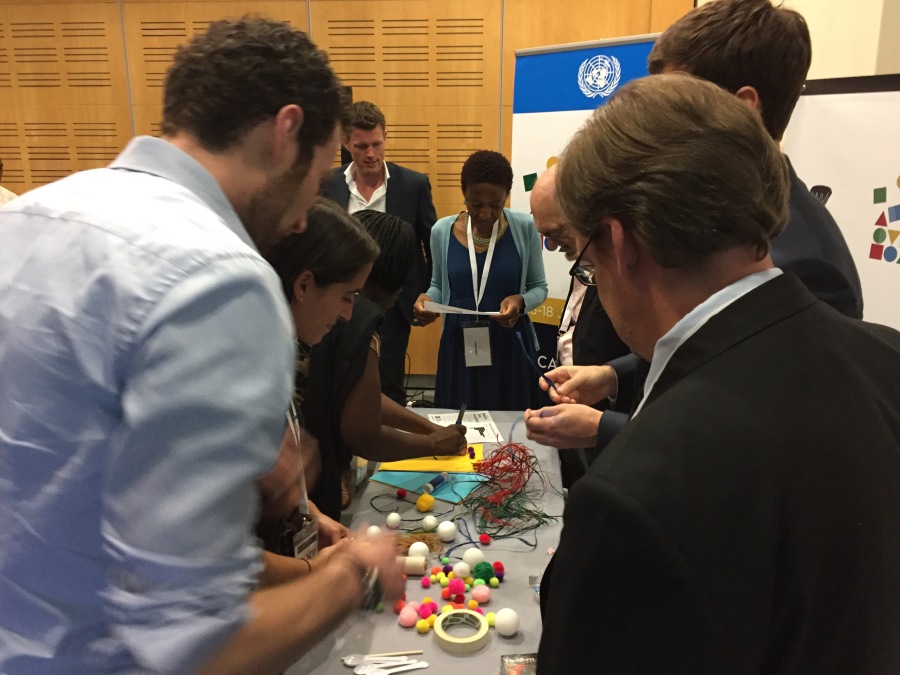
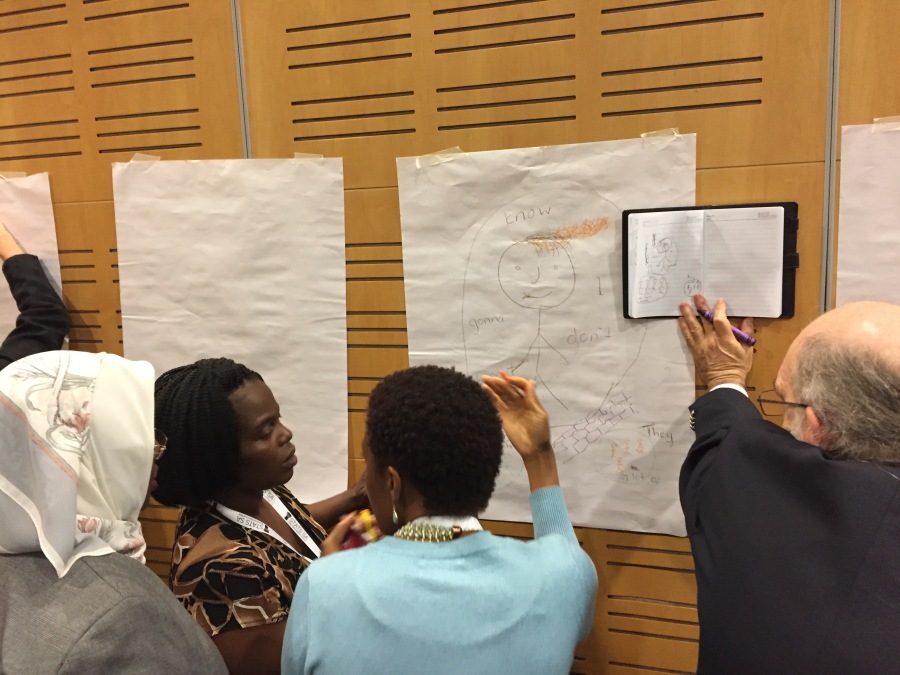
With Catherine D’Ignazio, I’ve been creating hands-on, participatory, arts-based activities to support each of these. Some involve simple web-based tools, but none are about mastering those tools as the skill to learn. They treat the technology as a one-button means to an end. The activity is designed to work the muscle.

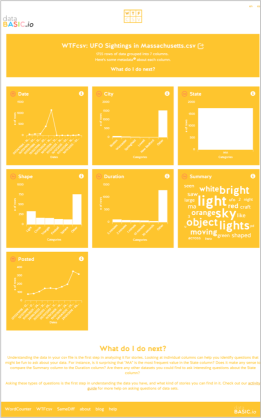
Curious about how those work? If you want to learn how to start working with a set of data to ask good questions, use our WTFcsv activity. Struggling to learn about the types of stories you can find in data?  Try our data sculptures activity to quickly build some mental scaffolding you can use.

Those are two quick examples. Here’s a sketch of all the activities we are building out and how they fit into the process I just described:

DataBasic_activity_diagram_pdf__1_page_.png

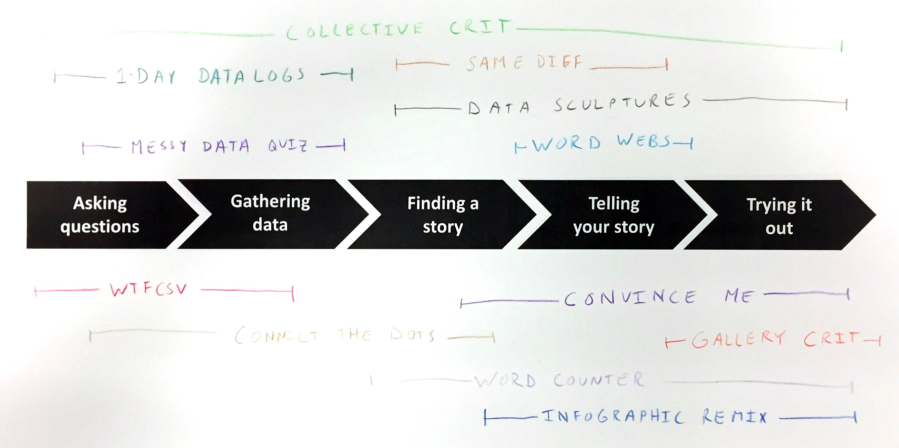
Some of these are old, and well documented on DataBasic.io; others are new and lightly sketched out on my Data Therapy Activities page; the rest are still nascent. We’re trying to build a road for many more people to learn to “speak” data, before they even touch tools like Excel or Tableau. These activities support this alternate entry point to data literacy; one that is fun and engaging to everyone!

Don’t get me wrong – there is certainly a place for learning how to use these amazing software tools. My point is that technology isn’t the only way to build data literacy.

You don’t need to be a computer whiz to work with data; you can exercise the muscles required with hands-on arts-based activities. We’re trying to build and document an evidence base demonstrating how the muscles you develop for working with data outside of computers easily transfer to computer based tools. Stay tuned for future blog posts that summarize that evidence…

Making Tools More Learner-Friendly

I often advise learners to be careful with what tools they choose to spend time learning.  Some powerful ones have steep learning curves, full of jargon and technical hurdles.  Others are simple and self-explanatory, but can’t do more than one thing.  I’ve been trying to find better ways to connect with tool builders and talk to them about how they need to build learner-centered tools.

Catherine D’Ignazio and I put these thoughts together into a talk for OpenVisConf this year.  This is a super-dorky conference for data viz professionals… just the place to find more tool builders to talk to!  We put together an argument that data visualization tool as informal learning spaces.  Watch the video below:

Empowering People With Data Workshop

I just ran a workshop for attendees at the 2017 UN World Data Forum in Cape Town, called Empowering People with Data: tips and tricks for creative data literacy”.  This was a great chance to connect my activities, and my work with Catherine D’Ignazio on DataBasic.io, to the non-profits and government statistical bureaus.  We’ll be doing more of this, as NGOs are coming to me more often to talk about helping them build their capacity to tell strong stories with their information.

img_5210
building a data sculpture (most materials were bought locally)

Many in the audience came up afterwards and were excited to bring the activities and approaches back to their organizations! Our fun activities were definitely new and novel for their world, and they immediately saw the value for many of the stakeholders they work with.

img_5221
sketching a story about lyrics found using our WordCounter tool

I’ve posted the slides on slideshare.net.  With examples including Praxis India, GoBoston2030, our data murals, and Peabody’s history quilt, I hope they created a richer set of inspirations for how to make working with data participatory and empowering!


Two New Academic Papers

If you’ve been to my hands-on workshops, you might be surprised to hear I’m also the “academic paper” kind of guy.  In fact, my position here as Research Scientist at the MIT Media Lab means that one of the way I contribute is by publishing academic papers.  I have two of those in the latest issue of the International Journal of Community Informatics, a special edition on Data Literacy.  Give them a read if you want a deeper look into either how our Data Murals work, or into the design and use of our DataBasic.io suite of activities and tools.

Special_Issue_on_Data_Literacy___Vol_12__No_3__2016____The_Journal_of_Community_Informatics.png

Data Murals: Using the Arts to Build Data Literacy

Rahul Bhargava, Ricardo Kadouaki, Emily Bhargava, Guilherme Castro, Catherine D’Ignazio

Current efforts to build data literacy focus on technology-centered approaches, overlooking creative non-digital opportunities. This case study is an example of how to implement a Popular Education-inspired approach to building participatory and impactful data literacy using a set of visual arts activities with students at an alternative school in Belo Horizonte, Brazil.  As a result of the project data literacy among participants increased, and the project initiated a sustained interest within the school community in using data to tell stories and create social change.

DataBasic: Design Principles, Tools and Activities for Data Literacy Learners

Catherine D’Ignazio, Rahul Bhargava

The growing number of tools for data novices are not designed with the goal of learning in mind. This paper proposes a set of pedagogical design principles for tool development to support data literacy learners.  We document their use in the creation of three digital tools and activities that help learners build data literacy, showing design decisions driven by our pedagogy. Sketches students created during the activities reflect their adeptness with key data literacy skills. Based on early results, we suggest that tool designers and educators should orient their work from the outset around strong pedagogical principles.


What Would Mulder Do?

The semester has started again at MIT, which means I’m teaching a new iteration of my Data Storytelling Studio course.  One of our first sessions focuses on learning to ask questions of your data… and this year that was a great change to use the new WTFcsv tool I created with Catherine D’Ignazio.

wtf-screenshotThe vast majority of the students decided to work with our fun UFO sample data.  They came up with some amazing questions to ask, with a lot of ideas about connecting it to other datasets.  A few focused in on potential correlations with sci-fi shows on TV (perhaps inspired by the recent reboot of the X Files).

One topic I reflected on with students at the close of the activity was that the majority of their questions, and the language they used to describe them, came from a point of view that doubted the legitimacy of these UFO sightings.  They wanted to “explain” the “real” reason for what people saw.  They were assuming that the sightings were people imagining what they saw was aliens, which of course couldn’t be true.

Now, with UFO sightings this isn’t especially offensive.  However, with datasets about more serious topics, it’s important to remember that we should approach them from an empathetic point of view.  If we want to understand data reported by people, we need to have empathy for where the data reporter is coming from, despite any biases or pre-existing notions we might have about the legitimacy of the what they say happened.

This isn’t to say that we shouldn’t be skeptical of data; by all means we should be!  However, if we only wear our skeptical hat we miss a whole variety of possible questions we could be asking our dataset.

So, when it comes to UFO sightings, be sure to wonder “What would Mulder do?” 🙂

Announcing DataBasic!

I’m happy to announce we received a grant from the Knight Foundation to work with Catherine D’Ignazio (from the Emerson Engagement Lab) on a new suite of tools called DataBasic!  Expect to see more here as we build out this suite of tools for Data Literacy learners over the fall.  Follow our progress over on DataBasic.io.

Knight_Prototype_Fund_-_Knight_Foundation

We propose to create a suite of focused and simple tools for journalists, data journalism classrooms and community advocacy groups. Though there are numerous data analysis and visualization tools for novices there are some significant gaps that we have identified through prior research. DataBasic is designed to fill these gaps for people who do not know how to code and provide a low barrier to further learning about data analysis for storytelling.

In the first iteration of this project we will build three tools, develop three training activities and run one workshop with journalists and students for feedback. The three tools include: (1) WTFcsv: A web application that takes as input a CSV file and returns a summary of the fields, their data type, their range, and basic descriptive statistics. This is a prettier version of R’s “summary” command and aids at the outset of the data analysis process. (2) WordCounter: A basic word counting tool that takes unstructured text as input and returns word frequency, bigrams (two-word phrases) and trigrams (three-word phrases) (3) TuffyDuff: A tool that runs TF-IDF algorithms on two or more corpora in order to compare which words occur with the most frequency and uniqueness.