
I just returned from a fascinating week in Belo Horizonte (Brazil), where we ran multiple workshops to build capacity to work with data in creative ways. The trip was organized by the Office of Strategic Priorities of the State of Minas Gerais (they are members of the MIT Media Lab). This post is one in a series about the workshops we ran there.
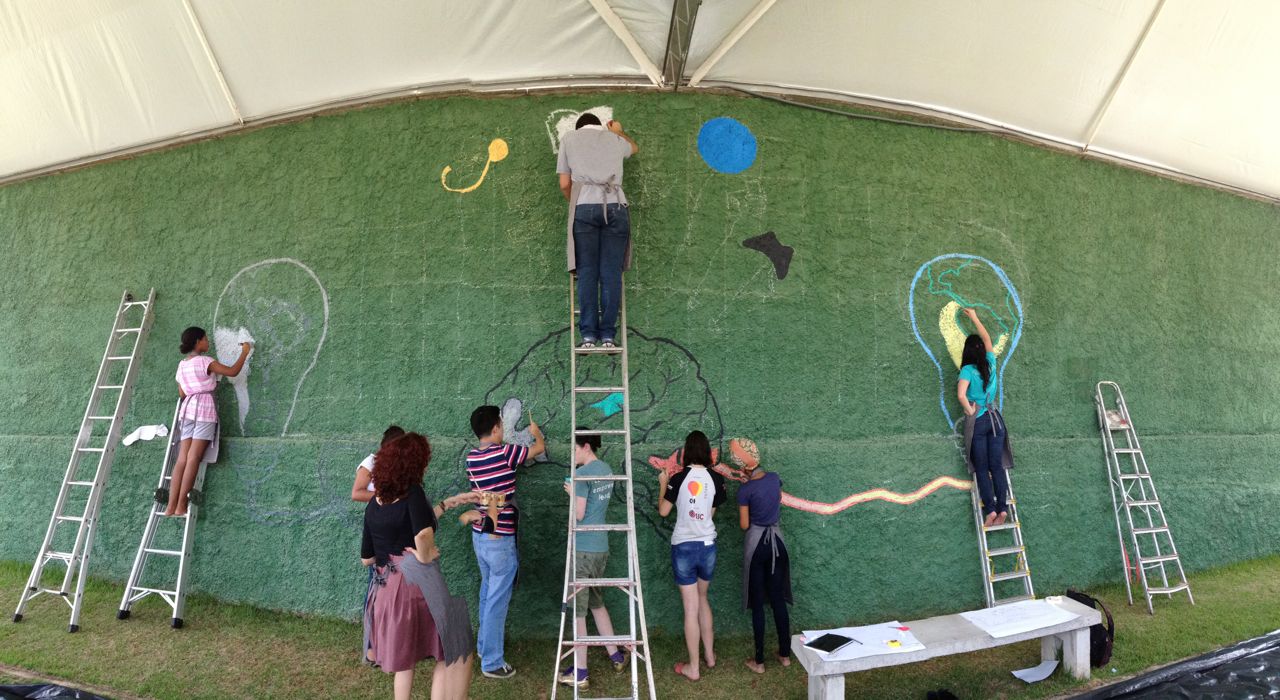
The most fun we had on our trip was designing and painting a Data Mural with students at the Plug Minas school. This was a our standard Data Mural workshops process, compressed into just two days (including painting!). We worked with about 15 amazing students for the design session, and then had over 50 people help during the painting day.
Interested in making your own Data Mural? Here’s an outline of our process.
Process
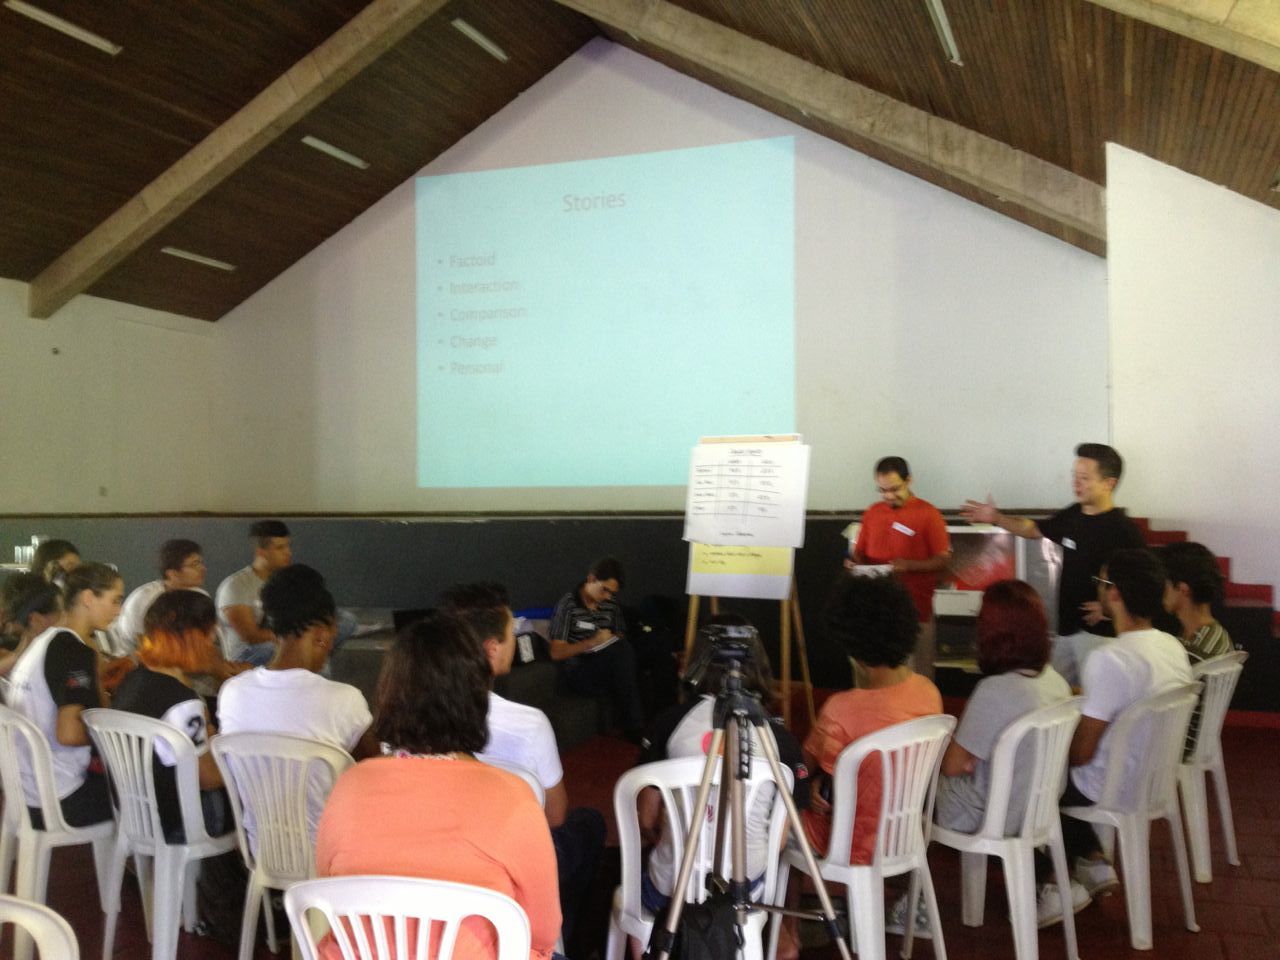
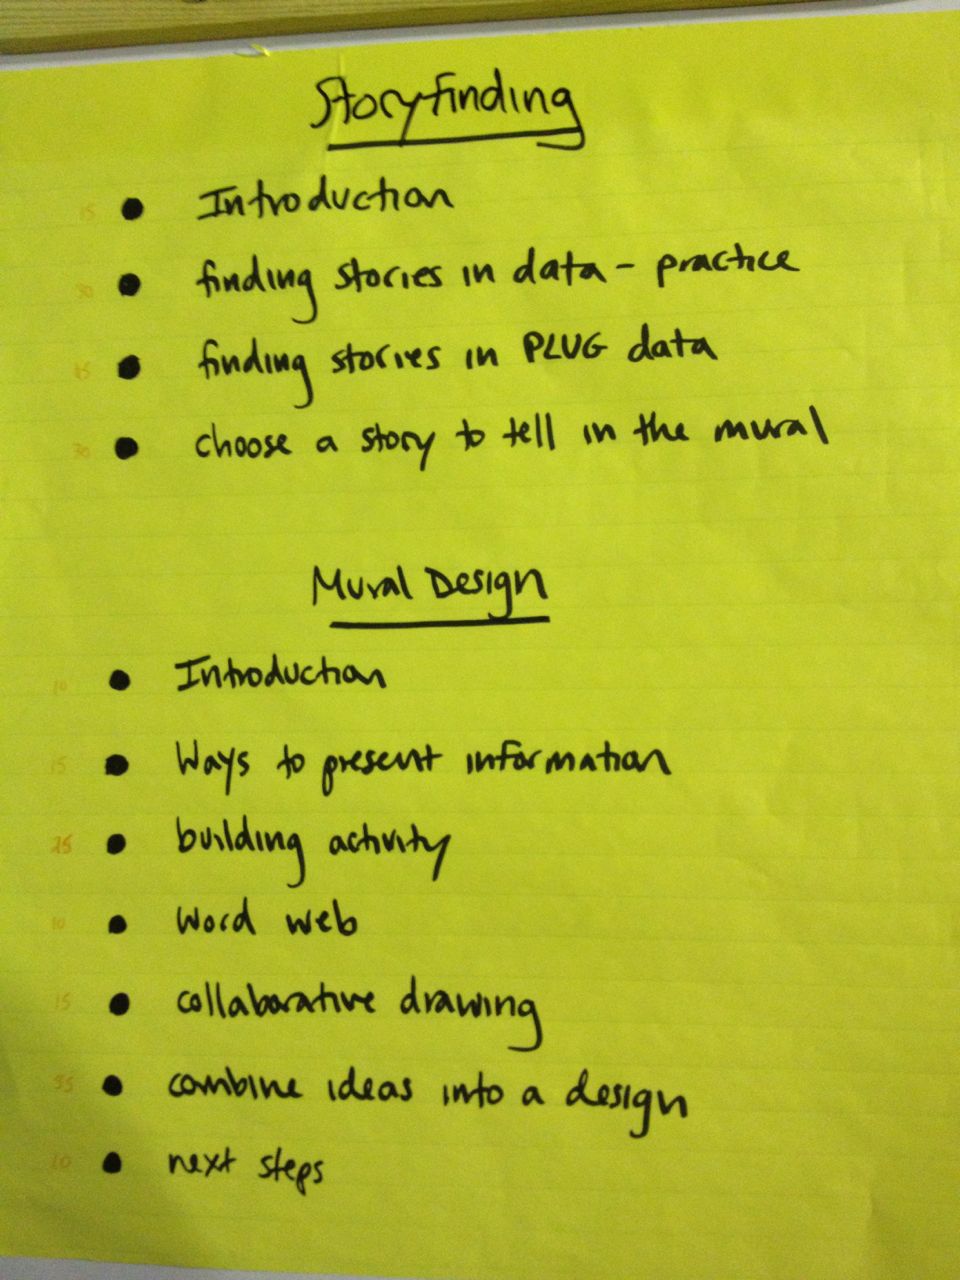
The first day we ran a story-finding workshop, and then a visual-design workshop. The agenda were rushed, but covered all the topics we usually cover. This was, of course, another chance to try out some new facilitation and learning techniques.
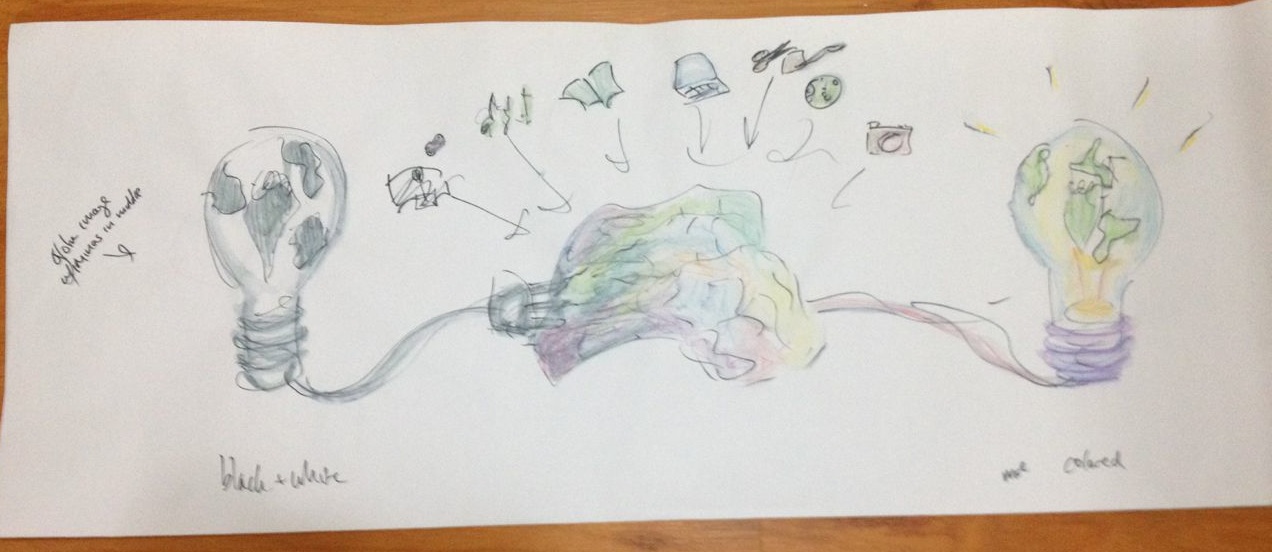
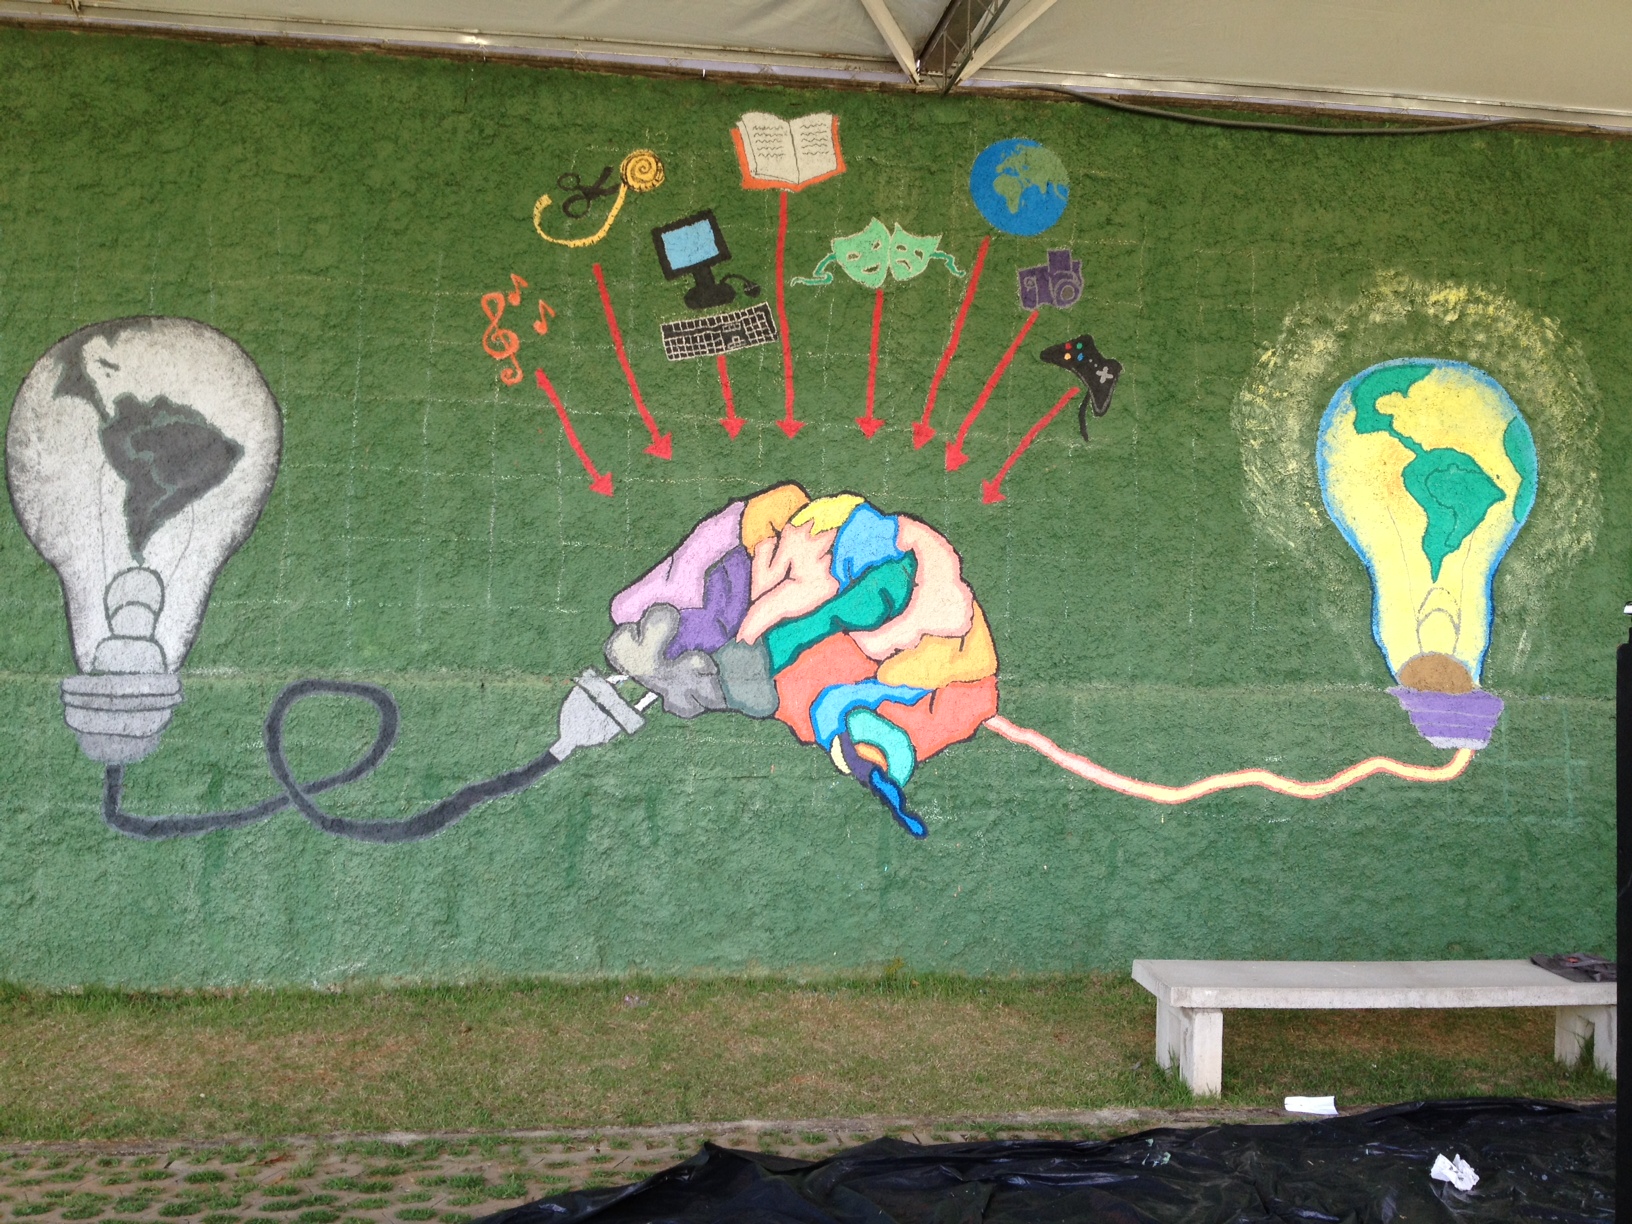
We started with a bunch of data about the school, enrollment demographics, public perception of their programs, and student satisfaction survey data. From that data, the story-finding workshop resulted in a story they wanted to tell about how students go through a process of transformation while at Plug Minas, and come out as better people.
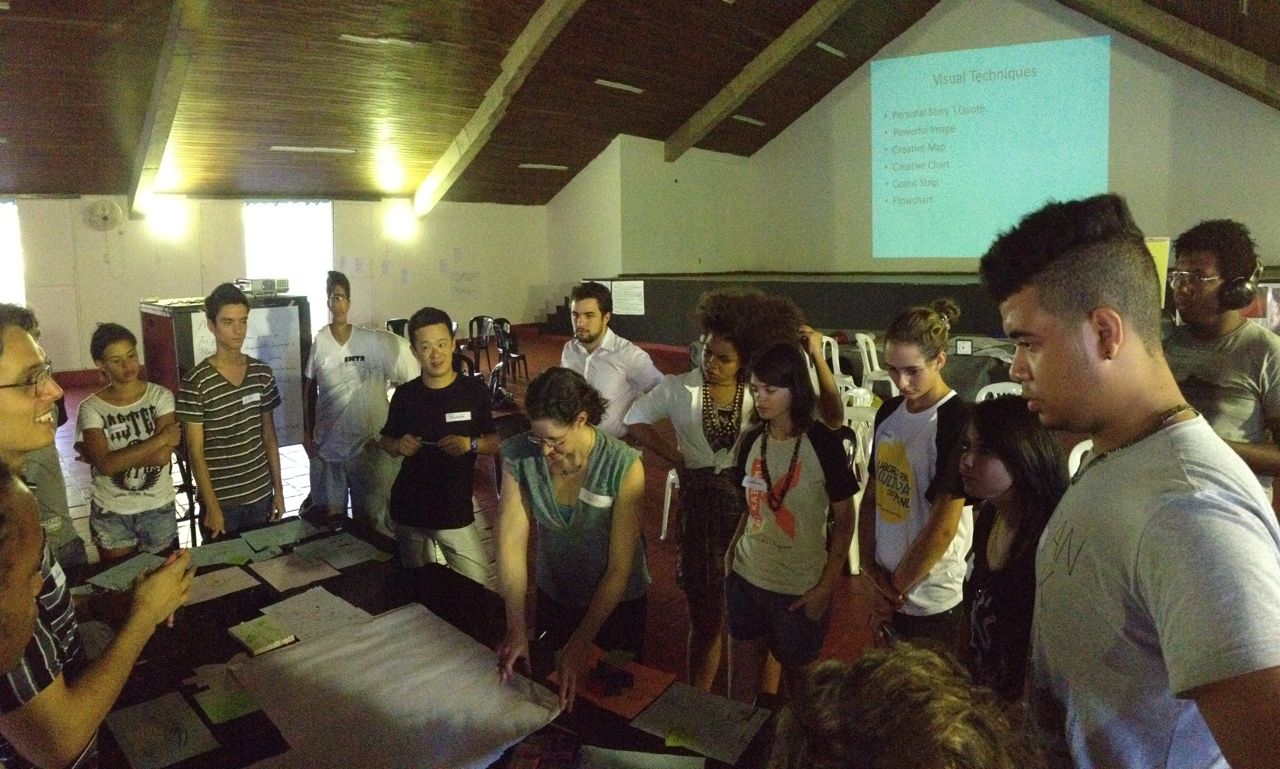
We then facilitated a variety of activities that helped them turn that story into a visual design for a mural!
And then we painted it! The video they made (at the top of this post) is an amazing view into that chaotic process 🙂
Reflections
Plug Minas is made up of a number of “Nucleos” – centers that focus on individual topics. Students tend to identify with these centers, rather than with Plug as a whole. One of the goals of this mural was to try to tell the whole Plug story, and the design they came up with definitely does that. The story of transformation has all the Nucleos feeding into the brain in harmony!
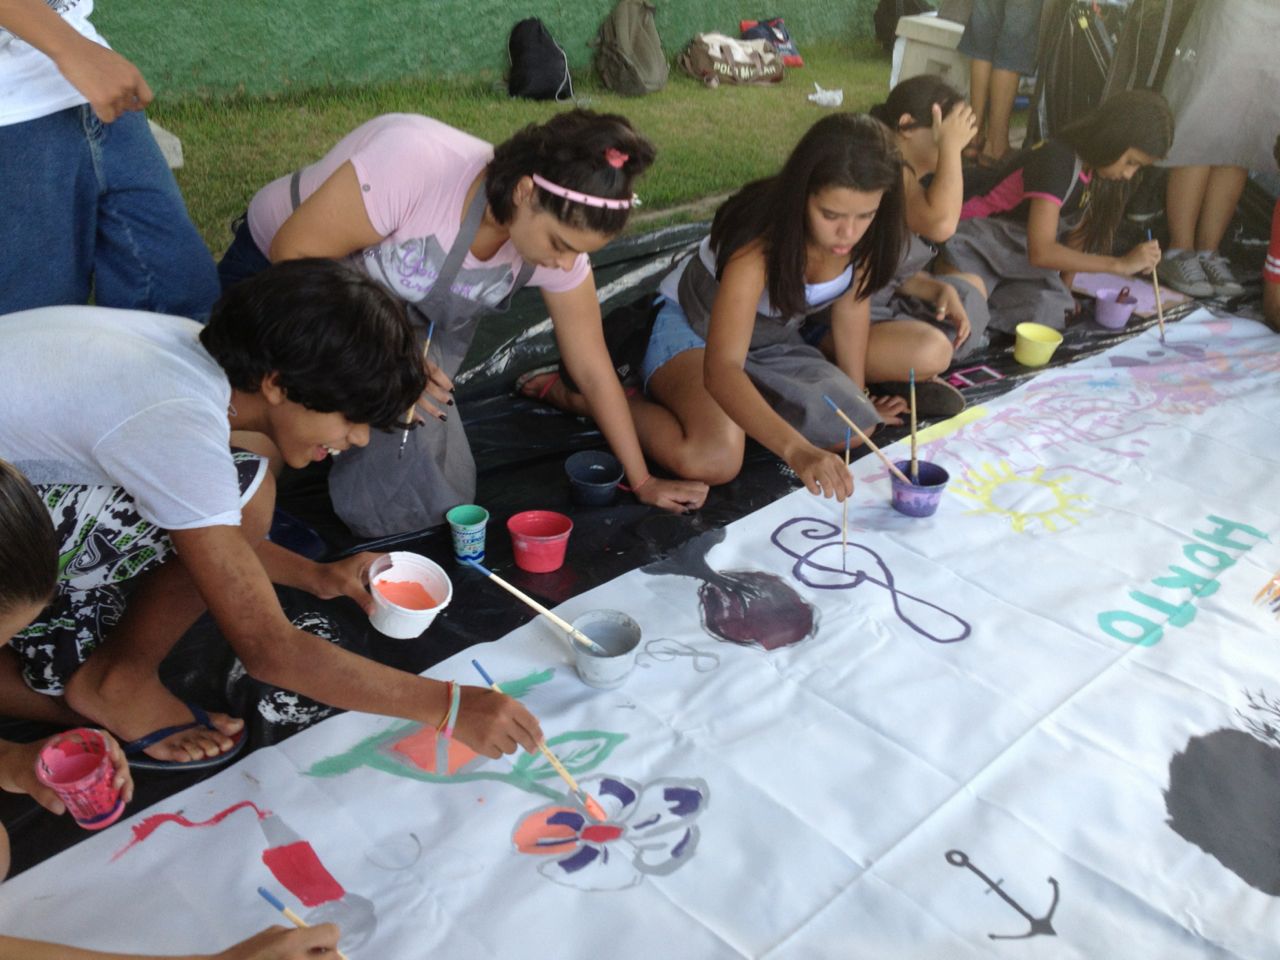
Another goal was to try and connect Plug more to the neighborhood it is in (Horto). One amazing way they did this was to hire an announcement car to drive around inviting folks to participate (it’s in the video above). We had a number of community members come help paint the mural, and as we finished we pulled out a big canvas to let others draw their thoughts about the neighborhood too!
On a different note, language is hard. We struggled to facilitate some of the more interactive conversations. For instance, when narrowing down to one story, or combining ideas into one visual design. Luckily, Emily’s 1 year of Portuguese training helped her a ton – so she led those sessions. That said, it was still incredibly difficult to hear all the ideas and summarize connections back to the group. Facilitation like this is difficult in English already! Our collaborators, Ricardo and Guillerme, were AMAZING as translators.
Here’s Emily’s quick write up about the mural. Plug posted some pictures too.

One thought on “A Data Mural in Brazil!”
Comments are closed.