Teaching data storytelling is difficult. The norms, “canonical” readings, and the cutting edge evolve every month! With such an evolving landscape to work within, I relish the opportunities I have to explore something new and different with students in a focused way. This past week I had the great pleasure of doing precisely that at the invitation of the FHNW Institute of Industrial Design as part of their International Design Workshop. The week, which reminded me of MIT’s IAPsession, is an opportunity to bring in outside instructors to work with undergraduate industrial design students in the week that starts their spring semester. Fifteen students and I explored designing and building data sculptures based on exploring civic datasets. I’ve been writing about how I want to push the field of physical data storytelling, and I hope these contributions help. Here’s a run down of the project they made, and what I learned to inform my teaching practice.
recorded unrecorded
By Fiona Beer, Leon Rauscher and Stephan Jäger
Refugee crises around the world are heart-wrenching and complex. Measuring and understanding the scale of the movement is difficult. In Europe ongoing flows across the Mediterranean Sea have been amplifying for the past decade. This group decided to take on the challenge of telling a story about this refugee crisis to their fellow students by making a large data sculpture that you walk through.
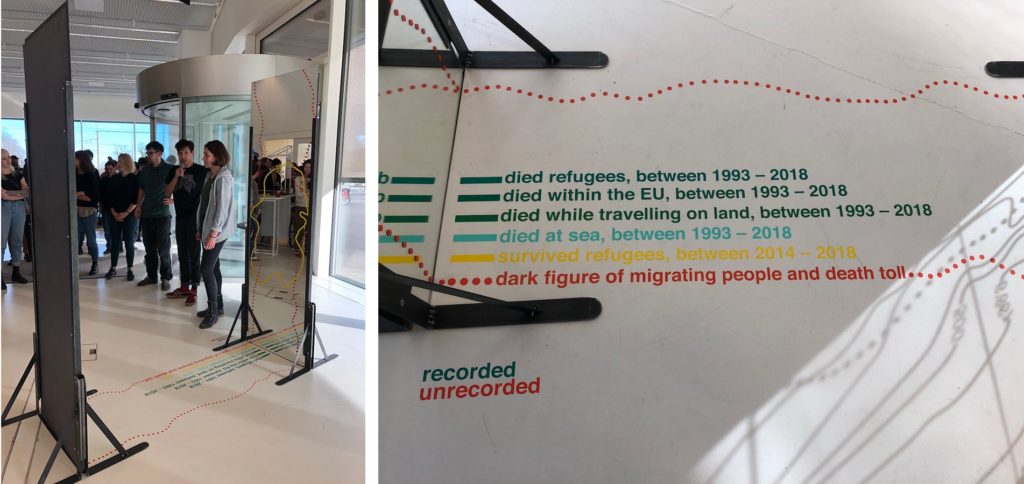
The piece centers around two mirrors facing each other, with lines and text decorating them, and invites the viewer to walk through. As they state:
This installation tries to show the number we know of, but simultaneously to represent the dark figure of deaths, names, age, origins, and causes of death, we have no idea of.
They acknowledge and embrace that reliable and complete data about migration, refugees, and deaths are impossible to come by.
Echoing the aesthetic of topographic map contour lines, they represent the “known” data on the floor and up the glass; one side for the living, the other for the dead. In addition, the dotted line suggests the data we don’t know, and have little way to estimate – the “dark figure of migrating people and death toll.”
This is all fairly readable from outside the sculpture, but stepping in between the mirrors creates an infinitely repeated landscape. The contour lines extend on forever, echoing the endless journey undertaken by so many migrants. The numbers and lines become hard to read, echoing the truly unknowable nature (a creative approach to the problem of visualizing uncertainty the field struggles with).
I think the core metaphor of the contour lines and the reflections that underlie this piece are resonant and memorable. More importantly, for me they pulled off a visual and physical design that embraces the humanity of the data, rather than treating them as abstract numbers that mask the crisis.
Data Sources: 2018 migratory deaths, UN Refugee Agency Data Portal
Wealth Inequality in Switzerland
By Christina Bocken, David von Rotz and Silvan Häseli
Switzerland is a wealthy (and expensive) country, but there is large income inequality. This group was inspired by a piece from CBS This Morning to explore this inequality in Switzerland. They found, to their surprise, that just 2.5% of the Swiss population holds more than half all of the wealth. They decided to share this story, and what causes it, with a doll-house sculpture and a board game.
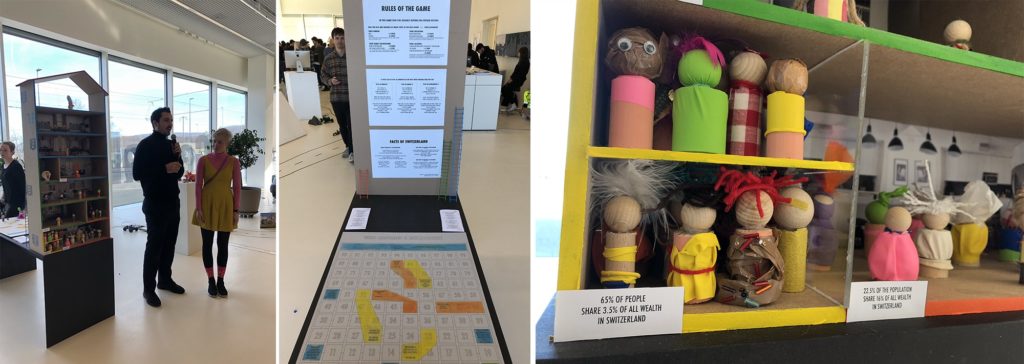
The multi-story dollhouse is divided into 3 sections about wealth ownership, each populated according to how much of the population holds that wealth. As the note on the yellow section states – “65% of people share 3.5% of all the wealth in Switzerland”.
To pull readers into why, they created a modified version of the popular snakes-and-ladders board game – called “Who Becomes a Millionaire”. Walk around back of the dollhouse and you’ll find a large playing board, dice, and instructions. Here’s the thing – the game is rigged. The rules change based on your gender, family background, education, and where you live! Playing as a woman nor born in Switzerland? Sorry, you don’t advance very quickly.
Inequality is hard to tell stories about, so I was excited to see this group take this challenge on. I think the house is a lovely invitation to come investigate the piece, and the board game is a creative pull to get the audience to dig in to the data more deeply. Building around the metaphors of the house, and the rules of the game being rigged, were key “anchors” to their design.
Data Sources: Swiss Federal Statistics Office
Medienkonsum 2020 (Media Consumption 2020)
By Eva Bieli, Valéire Huber and Sofia Leurink
Intrigued by our Media Cloud database of news reporting, and the surge of reporting on coronavirus, this group decided to explore the Swiss news landscape in 2020. News sucks us in; we want to read it, feel responsible to read it, but often end up left feeling powerless and upset by it. They found the top 3 themes written about were all depressing things – fears around coronavirus, aftermath from the assassination of Suleiman in Iran , and the tragedy of the Australian fires. This team asked “How consciously do you consume media? How do you digest bad news?”
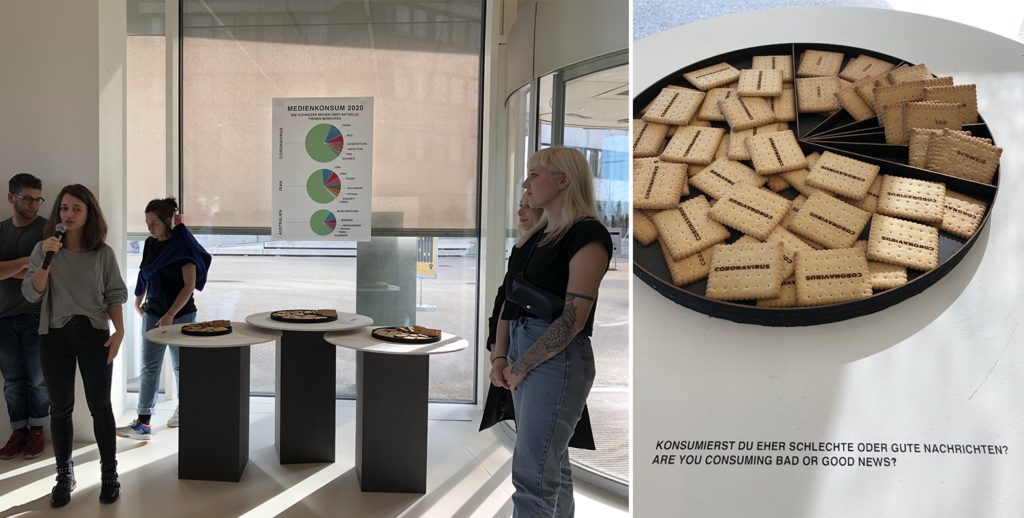
This piece is built around a visual and explanatory pun – the idea of “consuming media” like one does food. Mapping each topic onto a pie-chart style plate, they laser-cut words into biscuits based on their frequency of use when discussing each of those top three topics. This is a literal representation of the news we consume, and I can tell you that picking up a cookie etched with “coronavirus” certainly does give you pause!
I think this piece is a delightful provocation to think about the news we consume each day. The representation in food is an inviting way into a thoughtful topic, hopefully breaking down barriers the audience might have to reflecting about their own news consumption. The 3 plates are playful, pulling you over to understand why they are different sizes.
Data Sources: Media Cloud (Swiss national and local media source collections)
The True Cost
By Nathan Blain, Rino Schläfli and Daniel Mankel
The true environmental cost of the goods we produce and purchase is almost impossible to comprehend – there are just too many variables. This group rose to this explanatory challenge, creating an immersive multi-sensory piece that assaults your senses when you choose an environmentally unfriendly option.
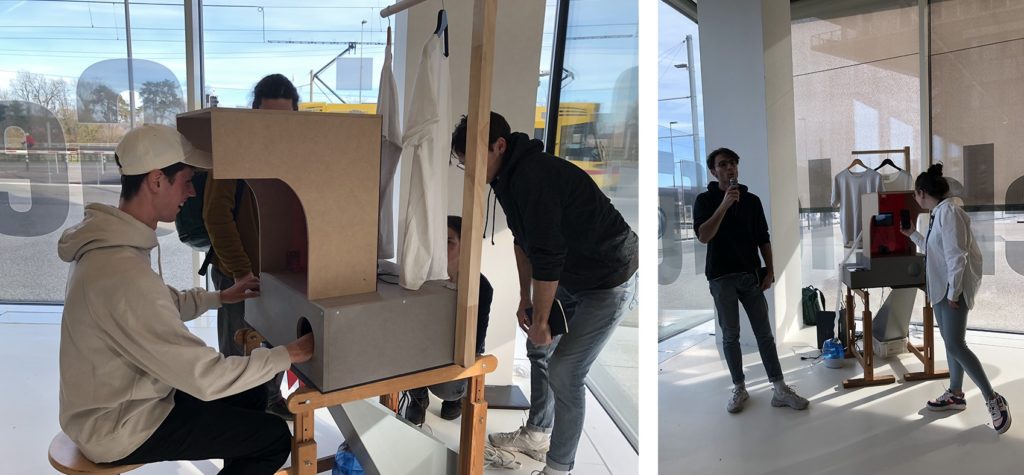
The piece present you with a choice between two identical-looking shirts, sit down and press the button associated with the one you want. Once your choice is made, three things happen that represent the environmental cost of the object:
- The animation and sound of water on a screen increase based on the amount of water used to produce the shirt.
- Smoke pours out at you (from a fog machine), obscuring your vision and making you pull back, based on the how many greenhouse gases are emitted in the production and transport of the shirt.
- Your other hand, inserted (trustingly) into a dark box, is sprayed with water based on the amount of water used to produce the shirt. Well, it doesn’t actually spray your hand yet… they almost had it working by the opening so hopefully they’ll get it working in another day.
I’m delighted by their idea of creating a multi-channel assault on your senses. We don’t have good approaches to communicating the un-captured costs of these goods. This piece is a provocation to consider the physical impacts of those choices on your own body, rather than in some far-off rain forest or ocean.
Data Sources: TBD (I’m not sure what they used)
The Mask Collection
By Jasmin Schnellmann, Jasmin Vavrecka and Timo Lanz
This group was struck by the public reaction and news reporting about coronavirus. While certainly it is cause for concern, they realized that global air pollution is a far more serious problem right now, in terms of deaths and scope. Trying to find a way to communicate this risk, they struck on the symbolic power of the medical face mask.
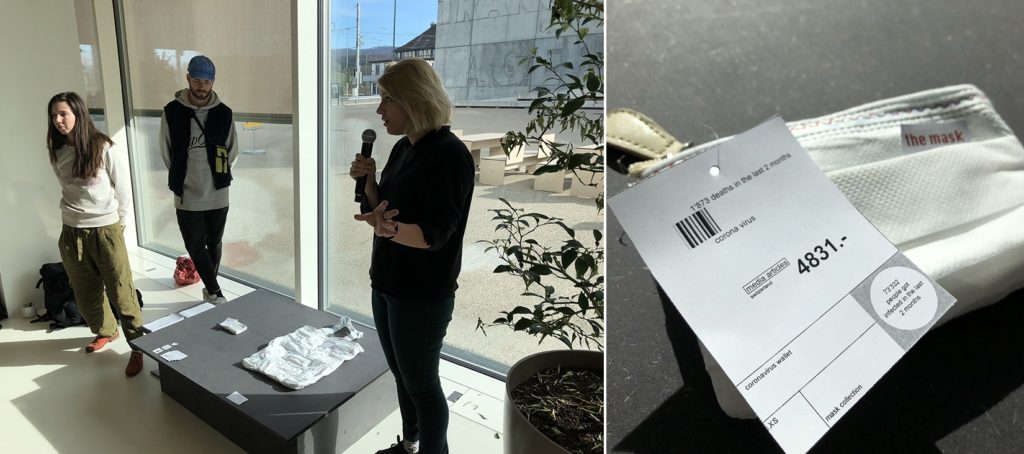
They created two objects for the mythical fashion show about “the mask collection”. The first is a small wallet made out of masks and sized based on the deaths due to Corona virus. The second is a large purse made of sewn together masks, sized by deaths due to air pollution. The viewer reading more closely is likely to be surprised by the “price tags” on each, with the small one having a higher one while the bigger one has a lower cost. These price tags show more detailed information about deaths and media coverage – which are inverses of each other. Air pollution has far more deaths but far less coverage (in 2020).
The objects they created speak very strongly to me. They make you look twice to understand how they are made, with strong red thread echoing a sense of importance and dread. It is a simple visual mapping, but presented as a collection of daily use objects they speak to the choices we make, and the risks we face, each day.
Data Sources: Media Cloud, Guardian UK and NYTimes articles, World Health Organization data portal
My Takeaways
I was impressed by the students creativity, fortitude, and craftsmanship. They created these in just one week(!) with no previous experience with data storytelling. I continuously challenged them to think beyond simple tricks like physical bar charts and such, and I think they rose to the challenge.
From this one week I can picture expanding my approach into a semester-long course that explores the aesthetic principles of physical variables of data sculptures. Externalizing these models and stories creates an opportunity to communicate around and about them, and affords me the opportunity to revisit back on my training in the pedagogy of constructionism.
This builds on earlier thoughts I captured in a paper with Catherine D’Ignazio at the Pedagogy and Physicalization workshop at DIS 2017. It also has links to projects from many other academics working on these questions of data storytelling and 3d physical materials:
- Data Physicalization workshop materials
- Data Physicalization wiki
- Findings from Dagstuhl seminar on Data Physicalization
I look forward to exploring these techniques with students and building my own data sculpture practice more. I hope they inspire, resonate, and challenge you as well! If you happen to be in Basel this Feb or March, these are on display for a few weeks.


You must be logged in to post a comment.