
A few years ago I went to the first UN World Data Forum and made some amazing connections with non-profits large and small (read more about that here). A common theme at that event was how to help organizations and governments get the data they needed to start work on the Sustainable Development Goals.
I just returned from the 2018 event, and found a new message repeated over and over – how can we help those who have data communicate about its potential and its impact? I’ll write more about that later. For now I want to share a bit about the session I ran with my collaborator Maryna Taran from the World Food Program (WFP). It was a pleasure to return to the event where we first met and speak to the impact we’ve had at WFP, and how the Data Culture Project has grown to a suite of 7 hands-on activities you can use for free right now.
Empowering Those That Don’t “Speak” Data
Our session was designed to focus on bringing the non-data literate into the data-centered conversation. The idea is that we can help these folks learn to “speak” data with playful activities that try to meet them where they are, rather than with technical trainings that focus on specific tools.
We introduced our arts-centric approach to creating participatory invitations through the data cycle – from data collection, to story-finding, to story-telling. Specifically, we ran our Paper Spreadsheets activity and our Data Sculptures activity. Maryna also shared how the WFP has rolled out a data program globally, where the Data Culture Proect activities fit into it, and some of the impacts they’ve seen already.
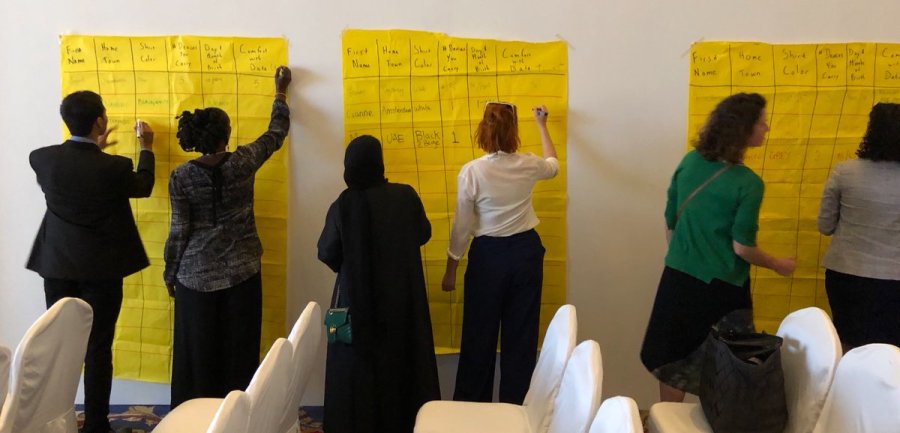
The Paper Spreadsheet activity led to a wonderful discussion of data types, survey question create, and security concerns. The Data Sculptures folks created were a great mix of different types of stories, so I highlighted some of the scaffolding we’ve created for finding stories in data.
One of the most rewarding comments at the end was from a woman who worked on the data analysis side creating charts and such for her team. She noted that she often will share a chart with others on the team and they’ll say “tell me the story”, much to her frustration – she just didn’t understand what they meant. What more did they want than the chart showing them the evidence of the claim or pattern? She was pleased to share that after this session, she finally had a way to think about the difference between the charts she was making and the story that her colleagues might be looking for! Such a wonderful comment that resonated with a lot of the points Maryna was making about how and why WFP is rolling out the Data Culture Project activities in parallel with their more technical data trainings.
Here are the slides we used, for reference:

You must be logged in to post a comment.