After finding a strong lack of artistic examples of data presentation, we decided to make some Data Murals of our own! We help a group find a story in their data, collaboratively crete a visual design that tells the story, and then paint it as a community mural. Read some more about creating your own data mural.
📰 Read our new academic case study about the mural we did in Brazil!
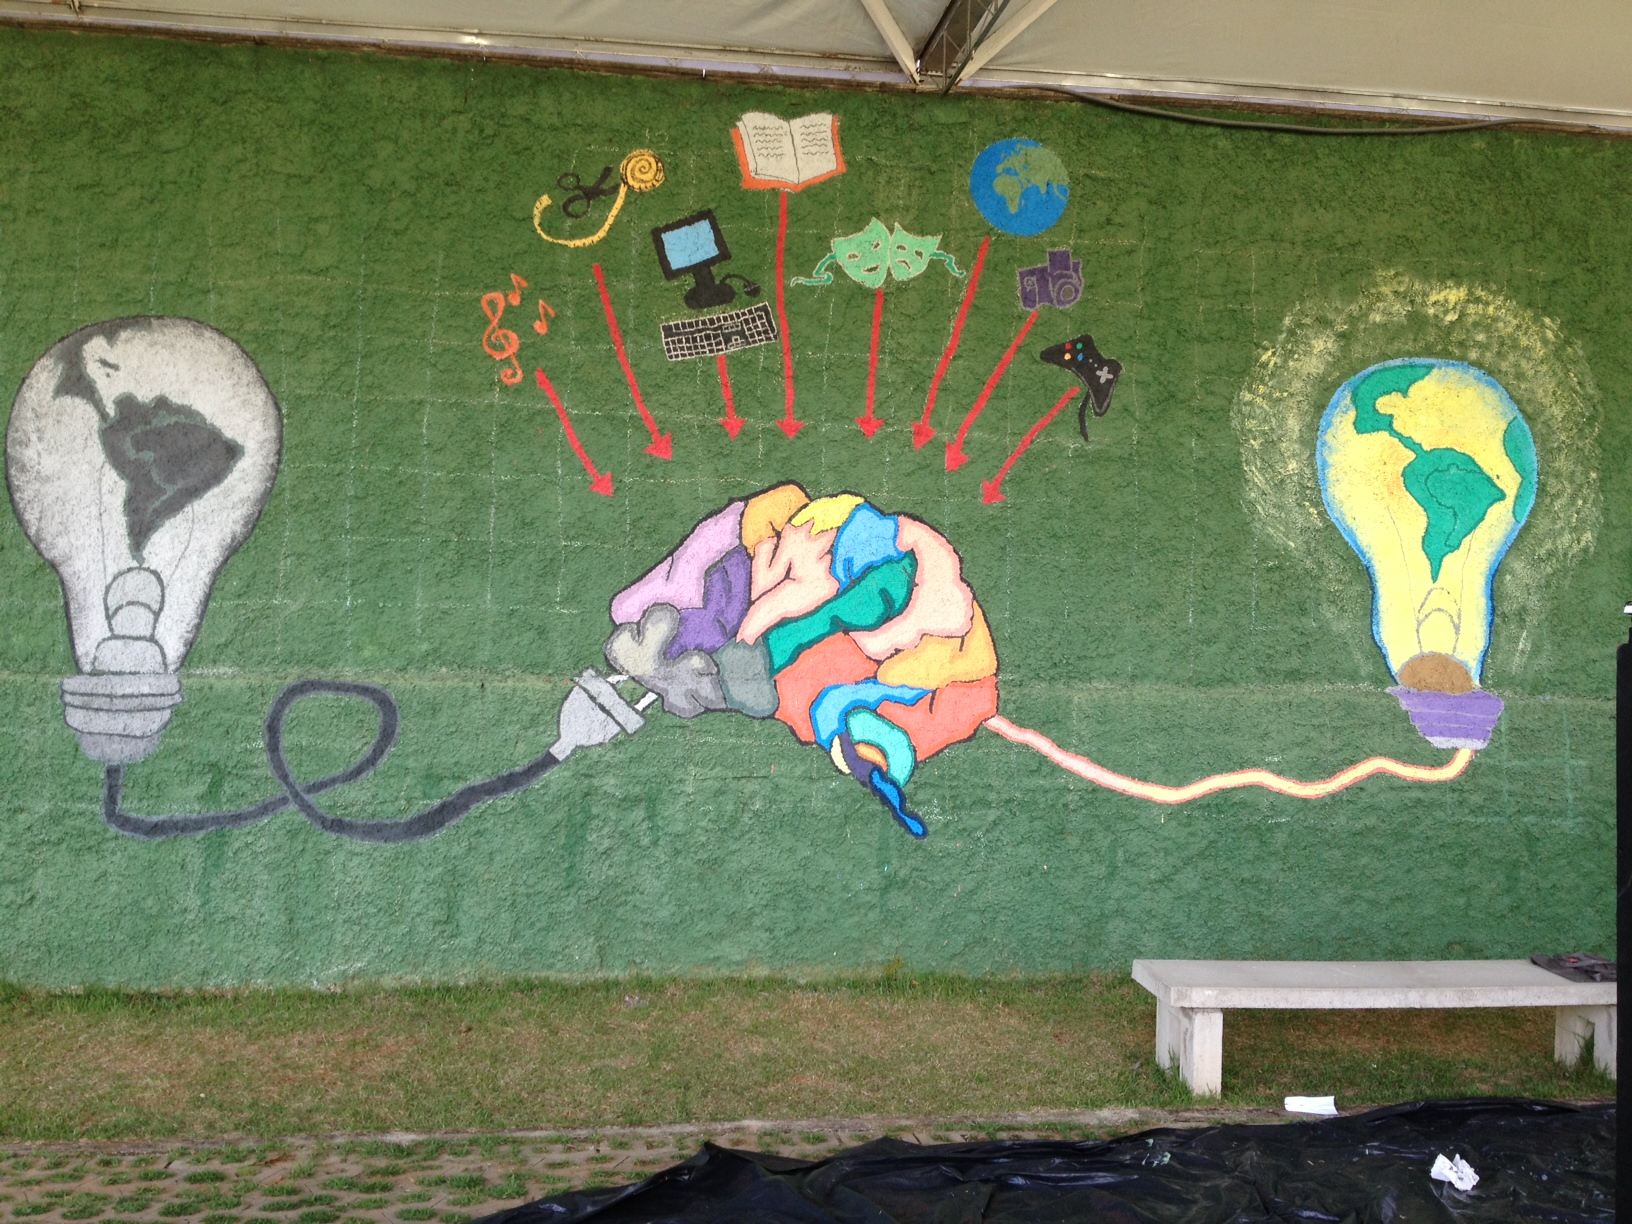
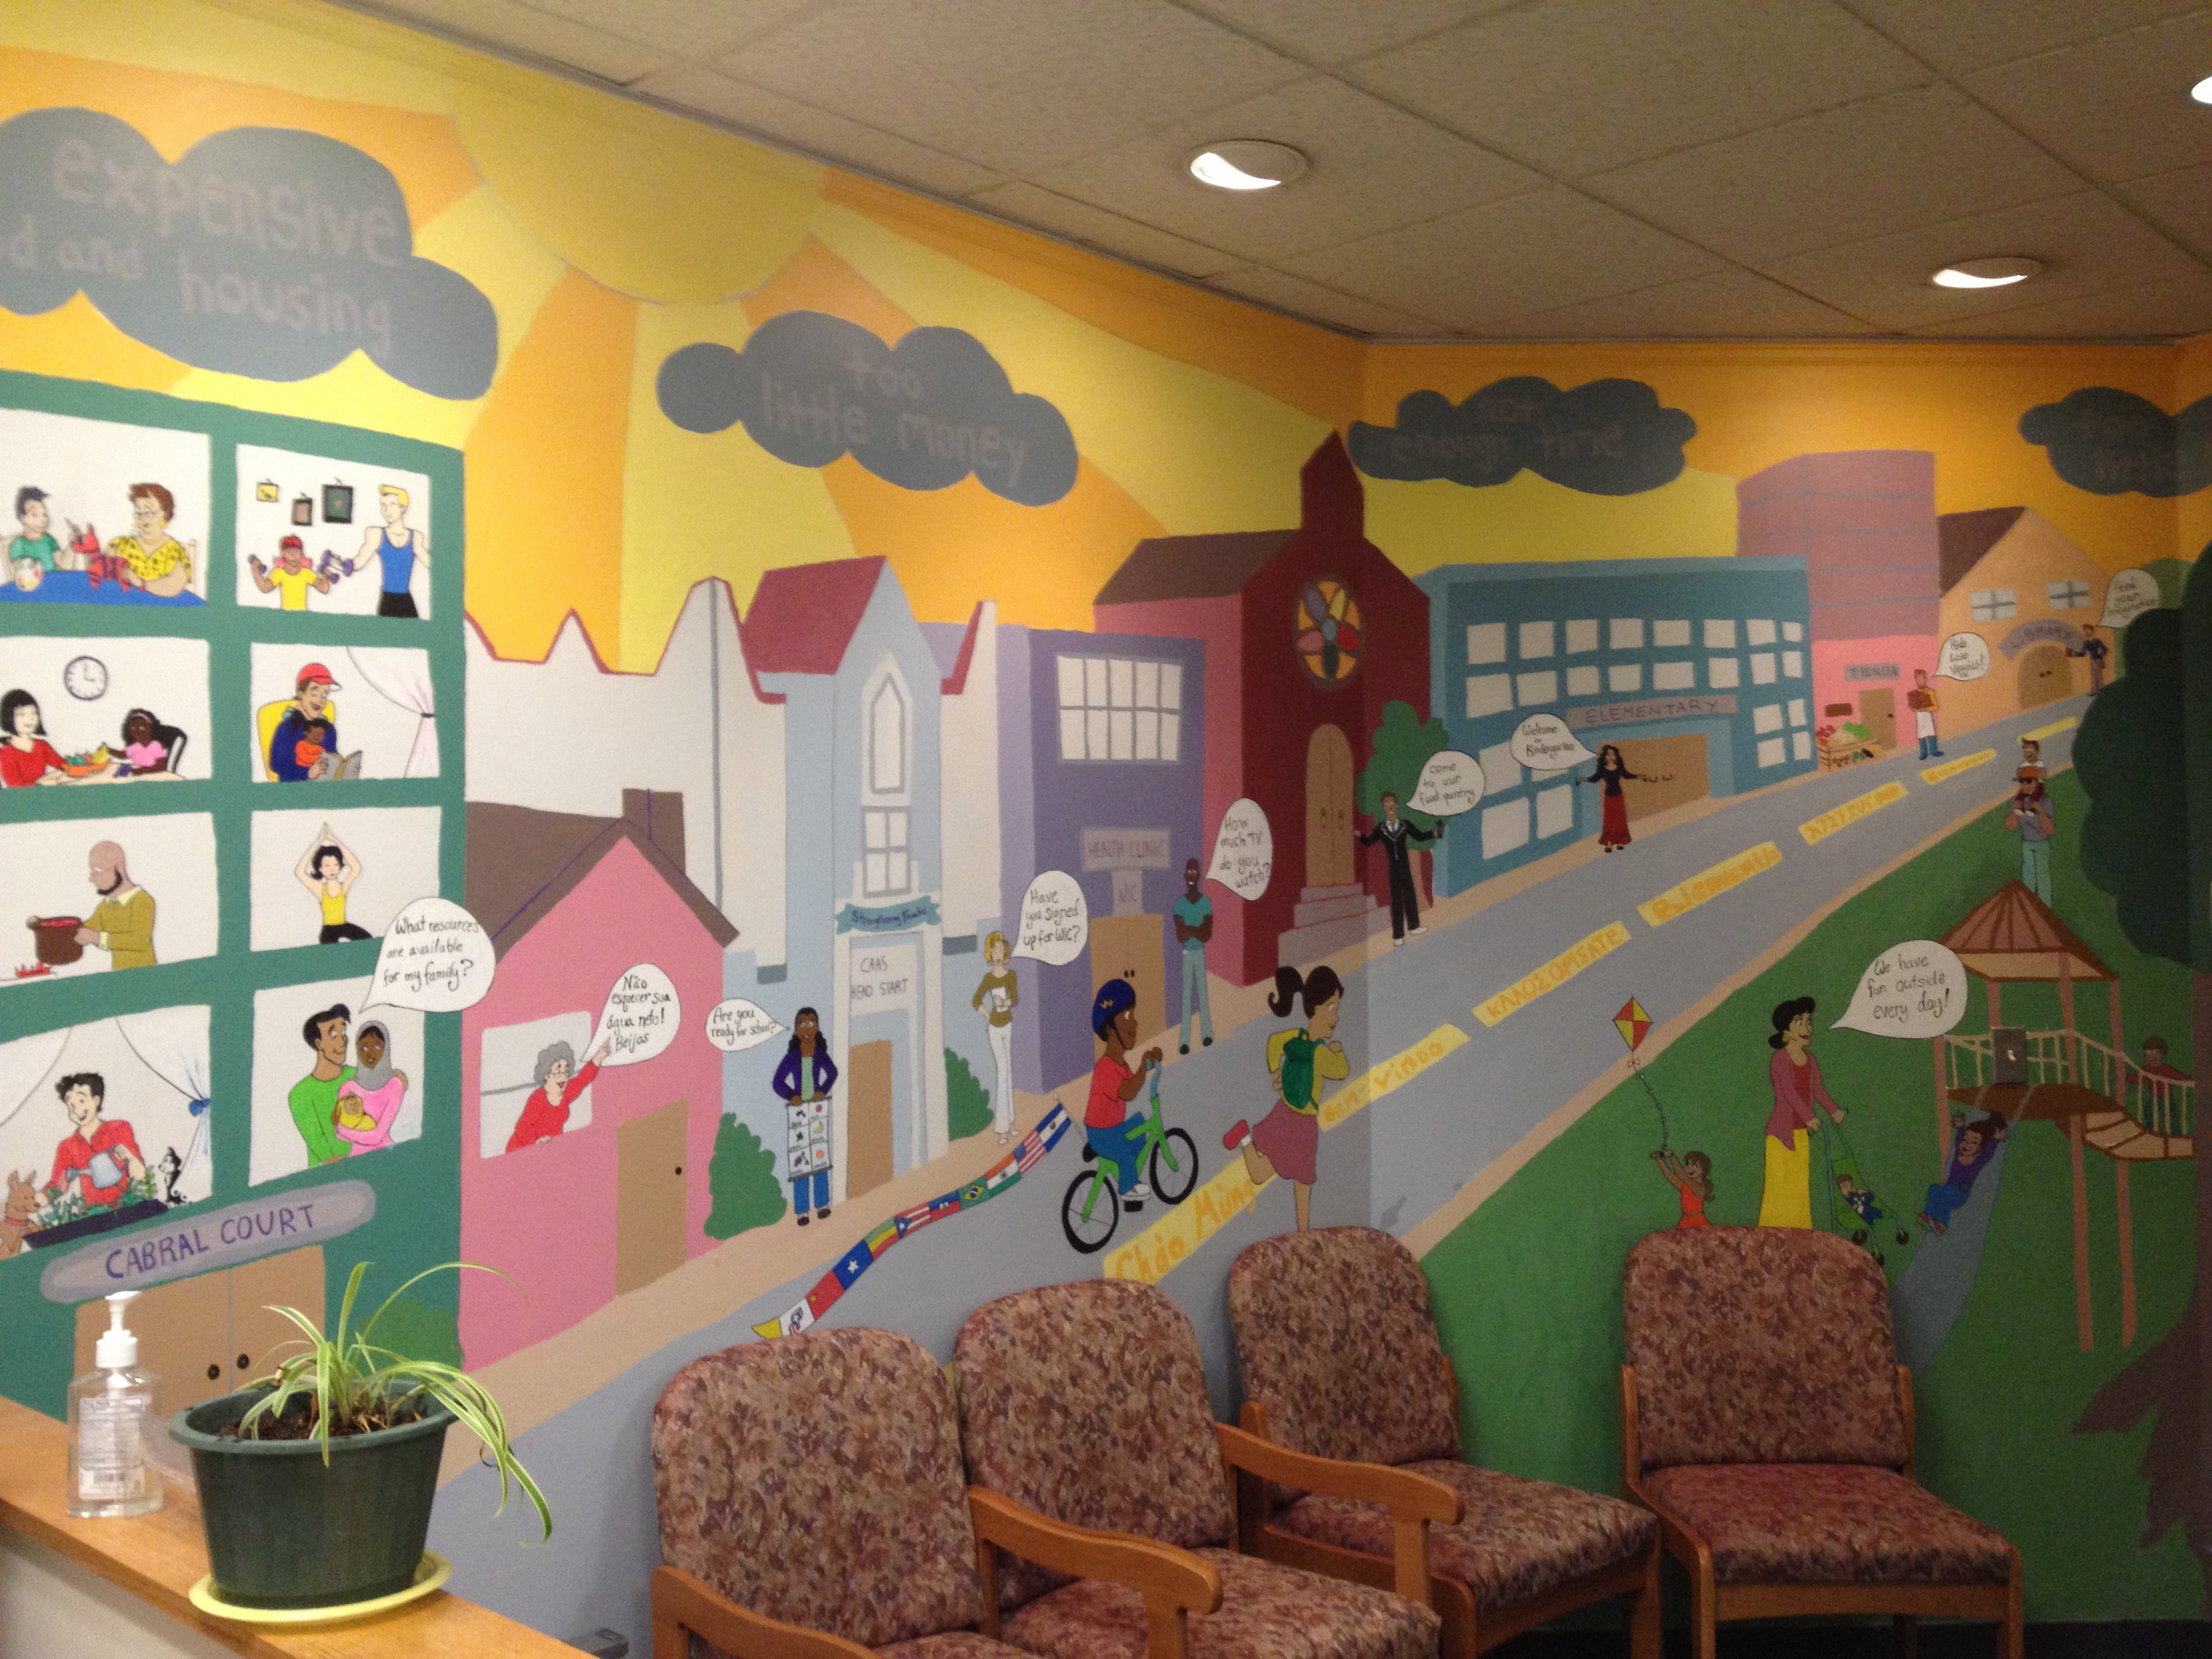
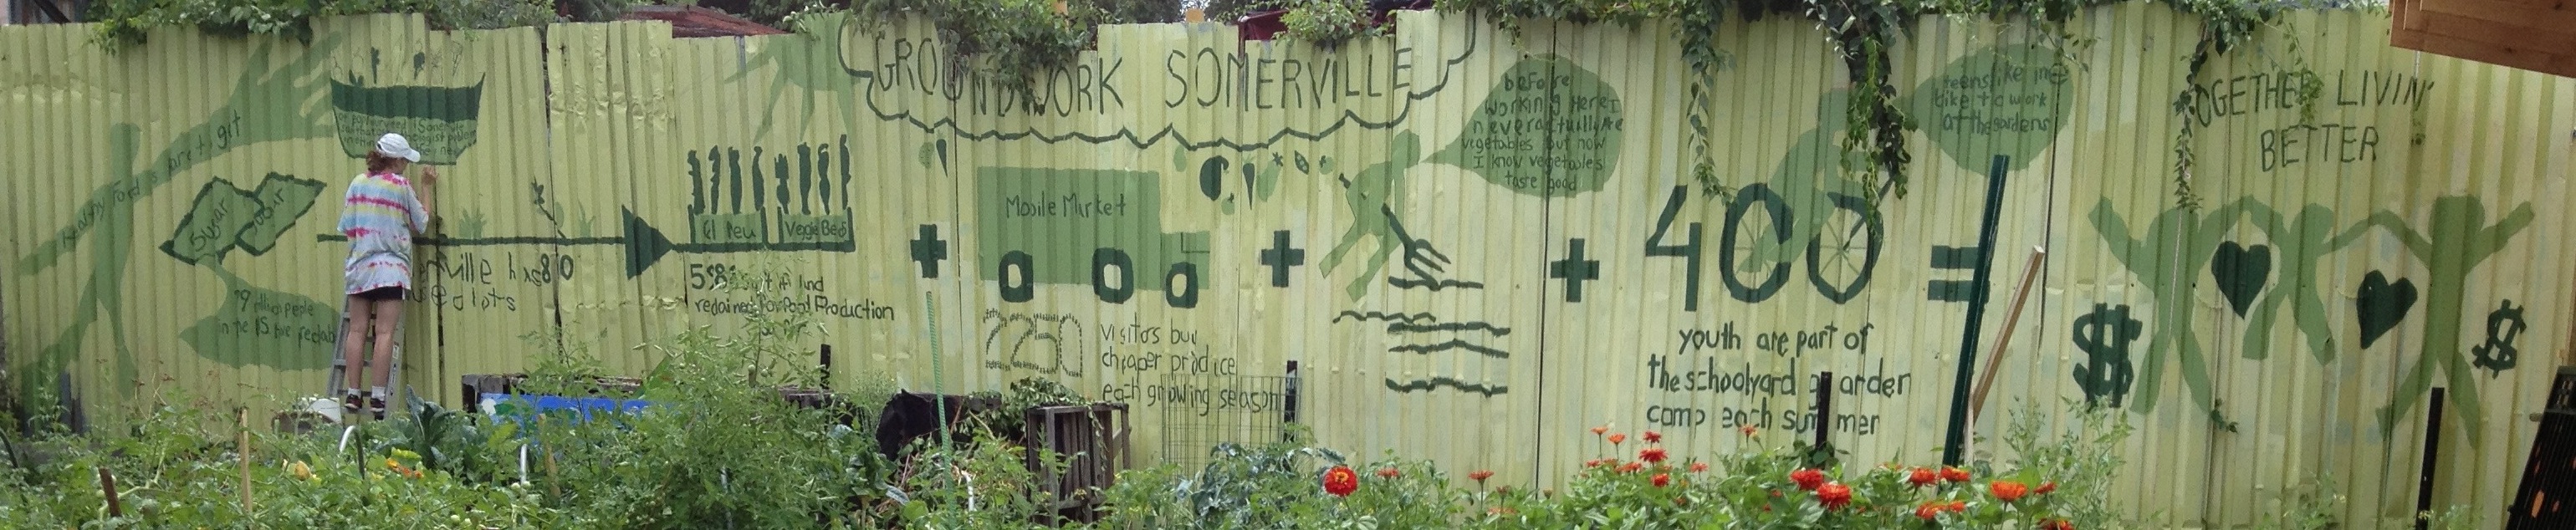
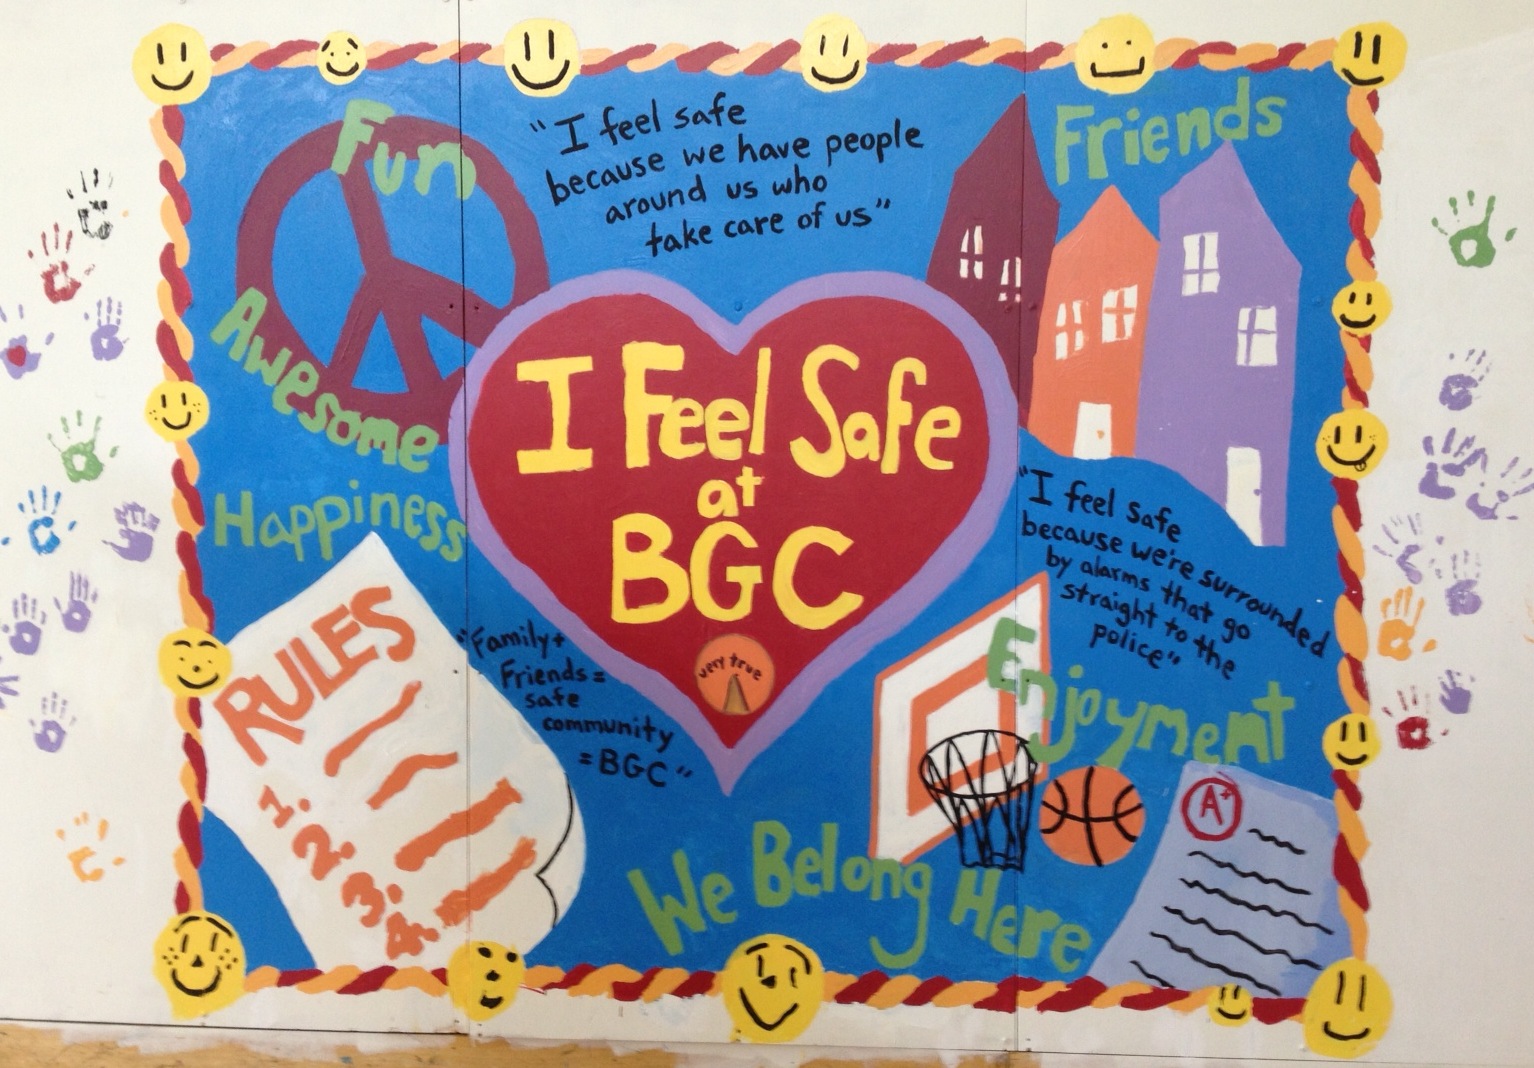
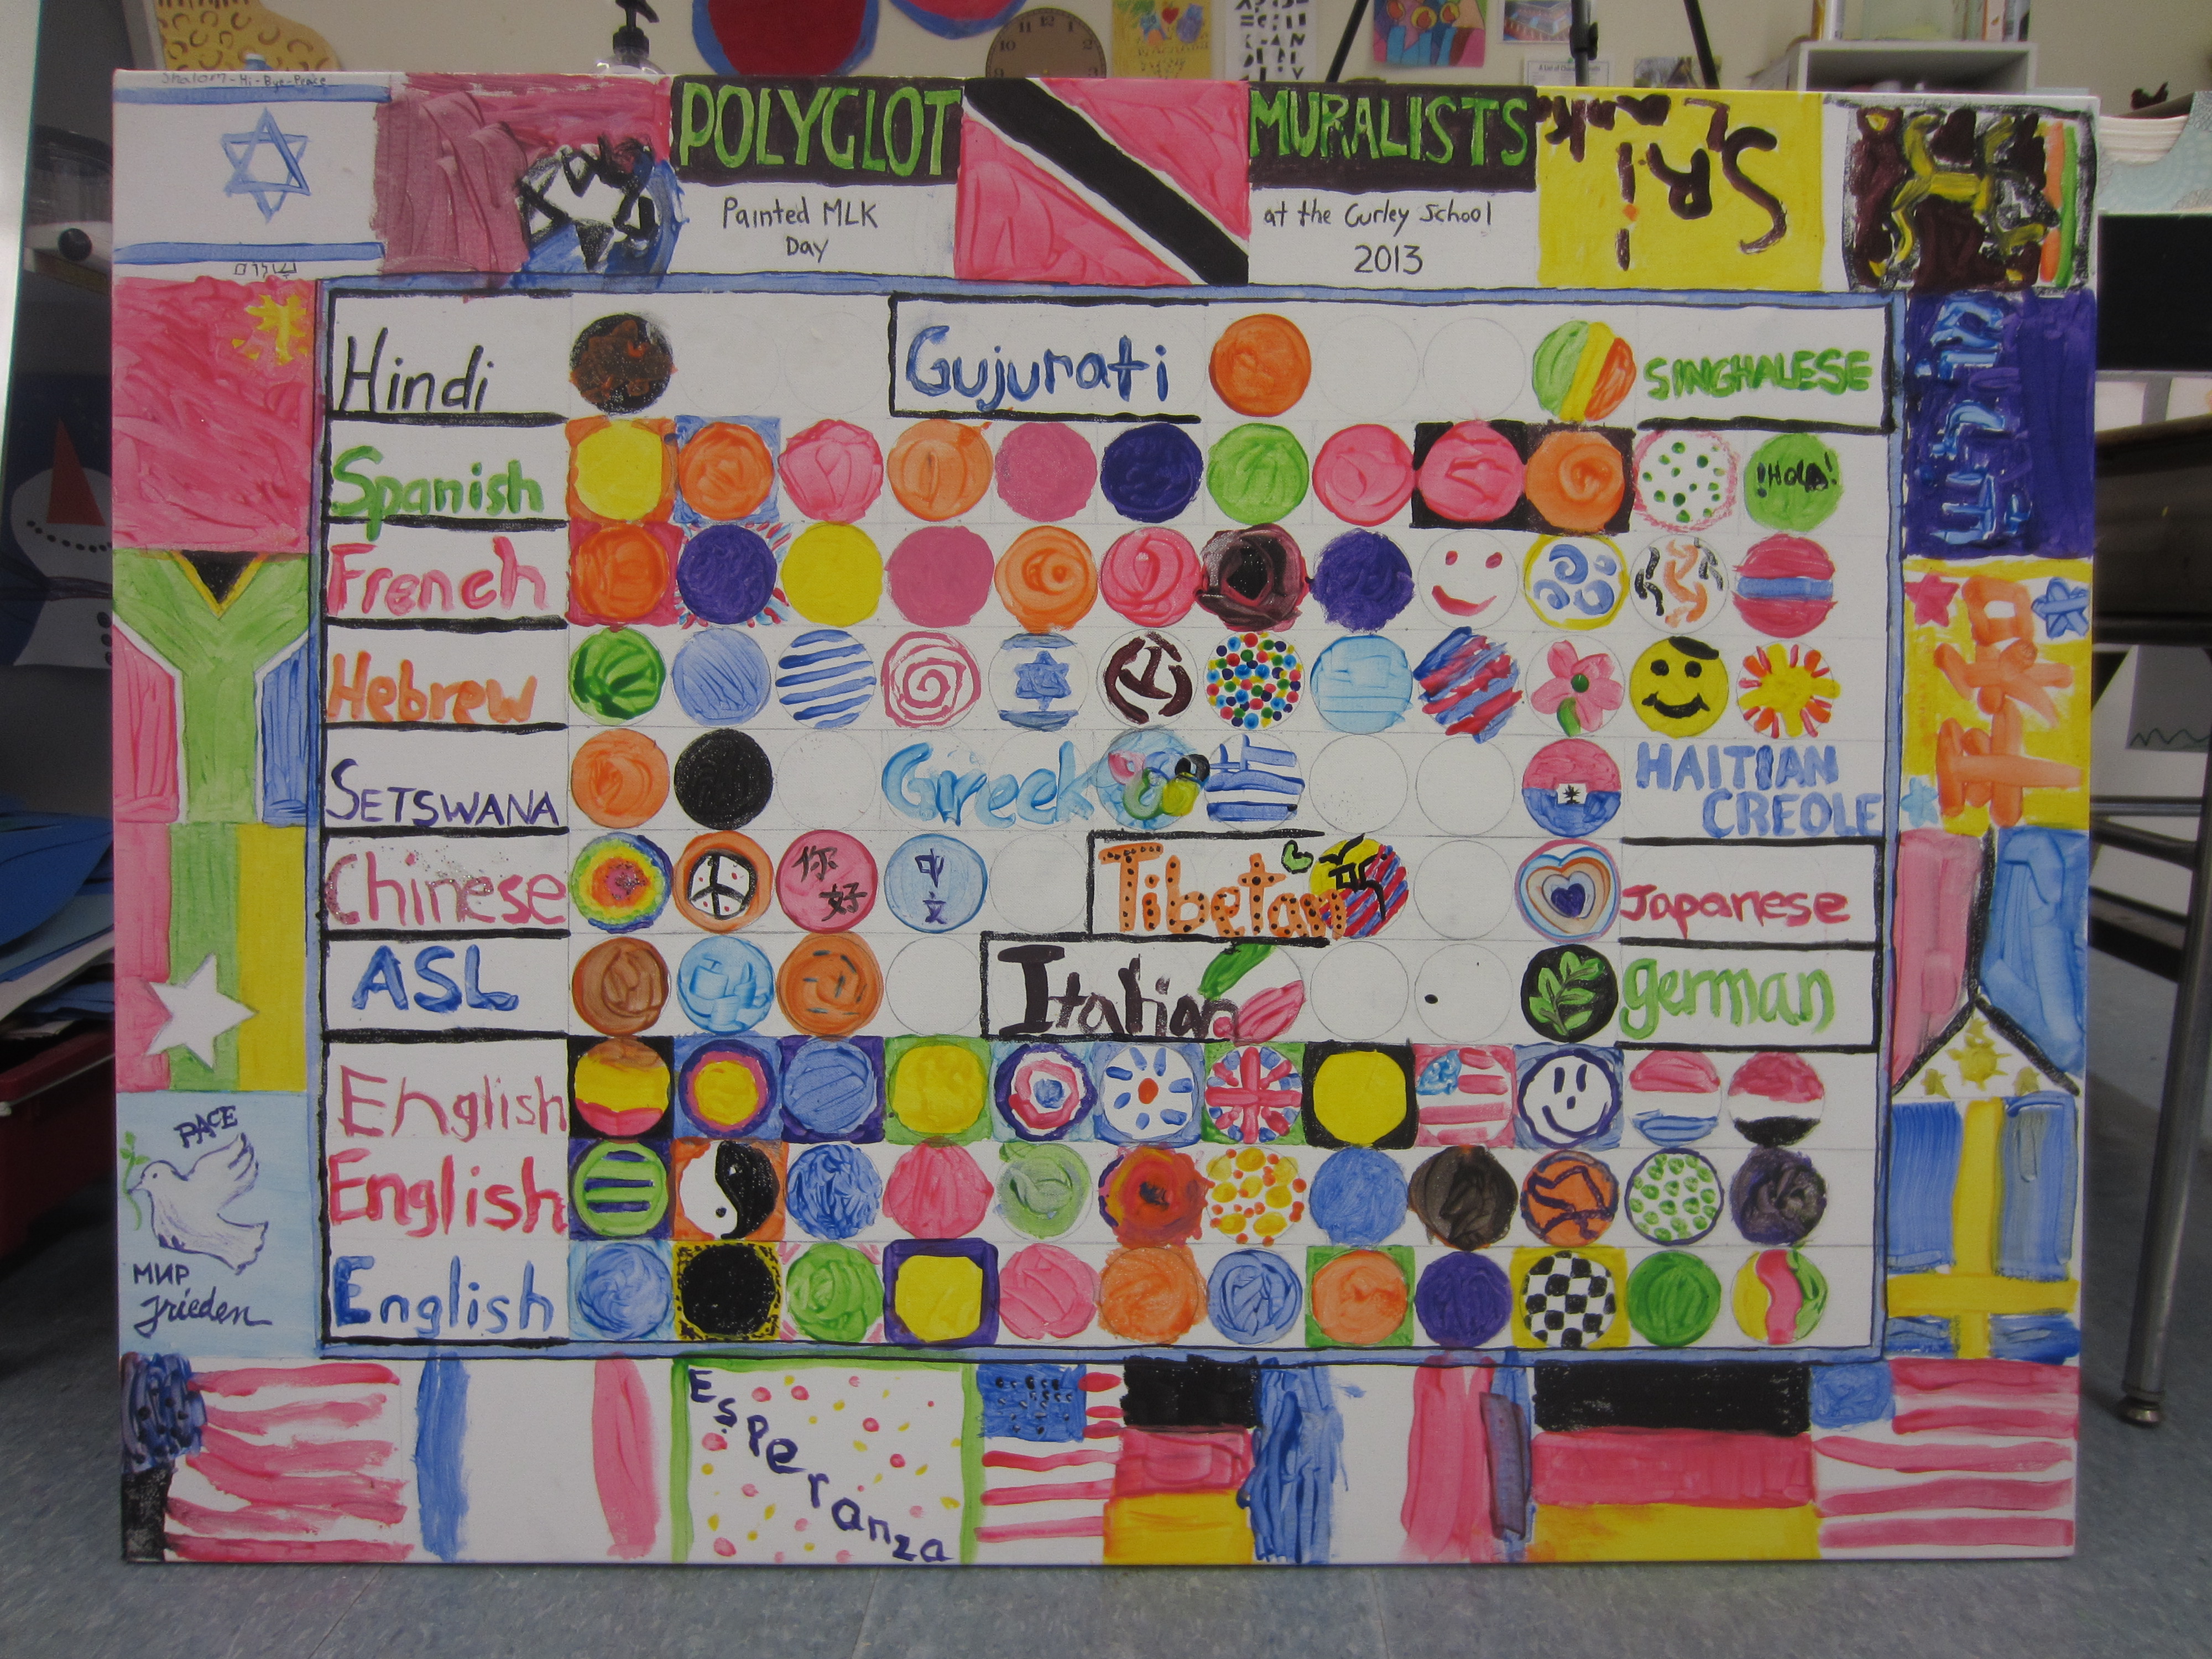
We’ve done a number of data murals, in the US and beyond. Here’s a small gallery of that work:
![Created by students at PlugMinas in Belo Horizonte, Brazil (March 2014)](jpg/plug-minase0b8.jpg)
![Created by the Somerville Food Security Coalition (November 2013)](jpg/food-securitye0b8.jpg)
![Created by the Collaborate for Healthy Weight Coalition (August 2013)](jpg/collaborate-for-healthy-weighte0b8.jpg)
![Created by Growndwork Somerville (August 2013)](jpg/groundwork-somerville0bc8.jpg)
![Created by the Boys and Girls Club of Cambridge, MA (May 2013)](jpg/boys-and-girls-club0ebe.jpg)
![Created by residents of Jamaica Plains, Boston (January 2013)](jpg/curley-schoole0b8.jpg)