
Each spring I have the pleasure of teaching MIT undergrads and grad students in my Data Storytelling Studio course. It is a hands-on, projects focused course built around creating quick prototypes of data-driven stories that try to get an audience to do something. This year the course focused on climate change as the theme, as part of the Boston Civic Media intiative. I provide relatively clean datasets they can use, sourced from online portals and local community groups. Over the course of the semester they work on building charts, creative charts, maps, creative maps, data sculptures, and interactive data experiences. Checkout the newly published full course content on MIT’s OpenCourseware site. Here is a quick run-down of their final projects.
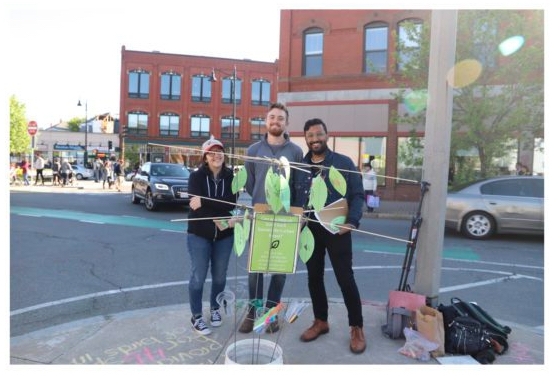
Building Back Somerville’s Urban Forests
Students in this group combined a few datasets to create a public event that motivated people to ask the city to plant more trees. They created the shadow of a “missing” tree on the ground and filled it with facts about the impacts and dangers to trees in the city. Visitors were invited to fill out paper leaves with their favorite tree stories and hang them on a tree the community built together. Their conversations with visitors illuminated how the public thinks about the tree canopy of the city, and how and why people were motivated to advocate for more. Read more about the project in their write-up.
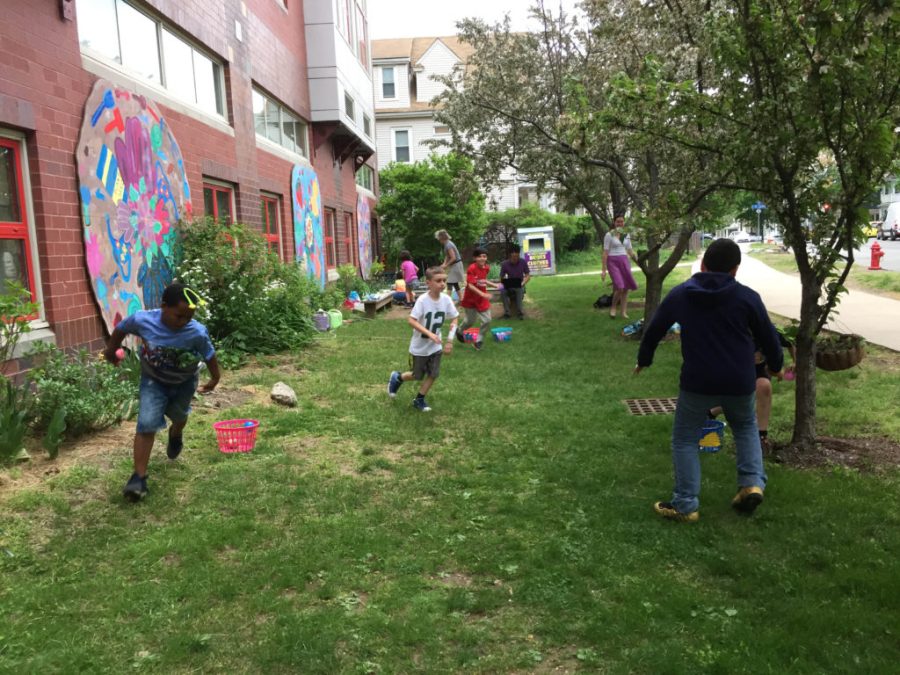
Save the Bees
This group used data about bees populations to create a playground game for 2nd and 3rd grade students. The game helps them learn about why bees are important to us, and how to protect them. The kids enjoyed the game thoroughly, and made great suggestions for how to improve it. The quotes from the kids illustrated their drive to understand more fully how bees help our planet, and what they could do to help. Learn more about the game in their write-up.
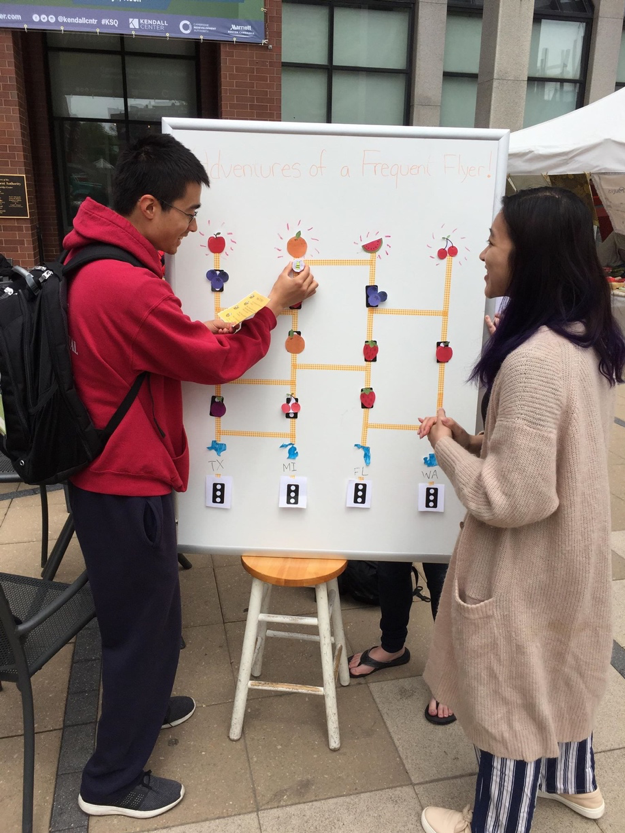
Adventures of a Frequent Flyer
This group created a game visitors to a farmers market could play to explore data about how bees are moved around the US to pollinate crops in various states. Their goal was to engage the visitors in advocating for better laws to protect bees that move through their states. Participants were invited to pick their favorite fruit, and then follow the bees as they travelled to the state that produced it most. Read their whole write-up here.
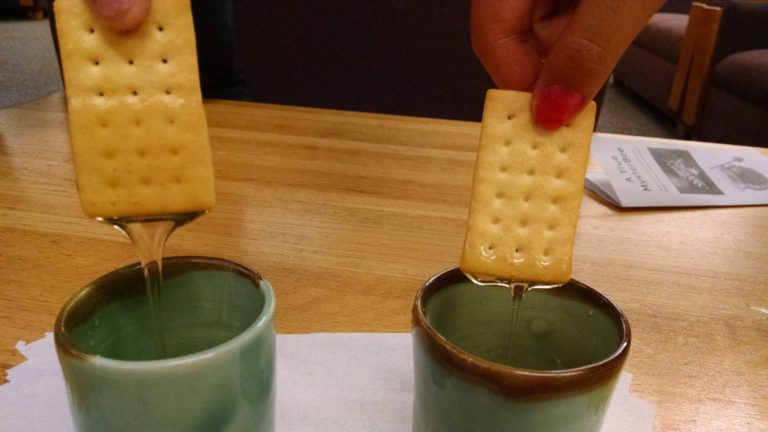
It’s a Mysterbee
This group focused on the MIT population of students, appealing to they sense of curiosity to motivate them to work on projects that might help bee colonies thrive. This interactive data sculpture invited participants to dip crackers in honey to find out about the volume of bee colony production in two different years. We don’t fully understand how bee colonies thrive and/or fail, which turned out bothers MIT students desire to understand everything! The projects across campus that were shared sparked folks who participated in the activity to get involved in the research. Read more in their write-up.

You must be logged in to post a comment.