
I’ve been connecting with more and more educators that want to take a creative approach to building data literacy with their students. Schools traditionally introduce data with in-class surveys and charting. This approach to generating their own data can be a wonderful way to empower learners to collect and represent data themselves. A more recent movement has centered around the STEAM movement – including the Arts along with the Science, Technology, Engineering, and Math curricular focus. I’m seeing a pattern at the intersection of these two approaches – educators are seeing strong engagement and results when they introduce their students to working with data through arts-based activities. Here’s a case study from a collaboration with the MIT Museum to flesh out how this can work.
Environmental Data Mosaics at the MIT Museum
This case-study was contributed by Brian Mernoff, one of my collaborators at the MIT Museum.
Each February, during Massachusetts school break, the MIT Museum runs a week of hands-on activities and workshops called Feb Fest. This year, the event was themed around our temporary exhibit, Big Bang Data, which explored how the increasing use of data affects technology, culture, and society. The purpose of the workshop was to let students view data sets of interest, understand these data sets, and share what they have learned with others in a creative and accessible way; all pieces of building their data literacy.
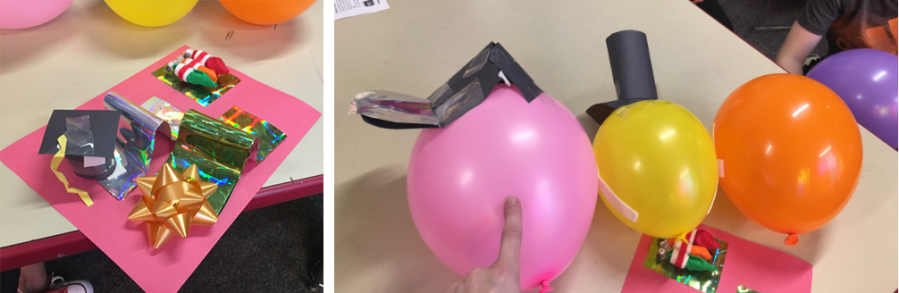
Data Sculptures as a Quick Introduction
As soon as students entered the classroom, they were asked to create a data sculpture based upon one of the sets of data placed at on their table. This is an activity the MIT Museum Idea Hub has already been running regularly. These data sheets contained relatively straightforward data sets to analyze, such as happiness in Somerville, and the cost of college over time. Art supplies were on the table, and the students worked with each other to create these sculptures while getting to know one another. After about half an hour each team presented how they decided to represent their data to the class. This activity was a great way to get them to get used to talking about data with each other and representing it in a novel way.
Building a Collaborative Data Mosaic
After presenting the data sculptures, we began the main activity for the day. Students were given a list of websites (see below) that they could visit containing environmental data in either graphical or numeric form (see the Environmental Data Search worksheet). Once they had explored the websites, they discussed these websites with a second group of two at their table and determined which one of the links was most interesting to them to explore for the remainder of the project. Once the website was chosen, they again worked in their original group of two to find a story in one of the data sets on the website using the “Finding a Data Story” worksheet. After doing so, the two smaller groups recombined and chose which of the two stories they would like to tell in the final project.
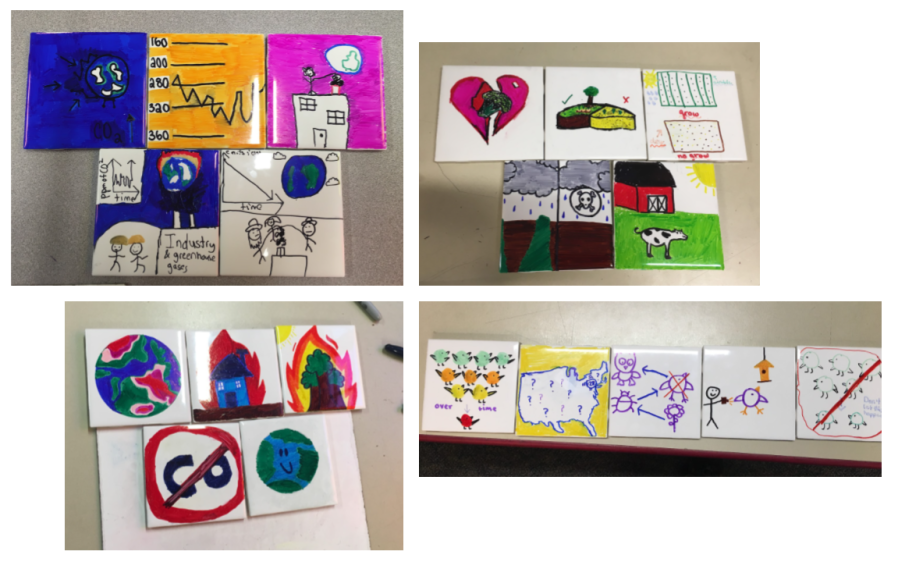
In their story, students needed to explain the problem the data connects to, what the data is and shows, why the data is important, what the audience of the story should do about it, and what would happen in the long run if the reader did what was suggested (see the Data Story Mosaic Layout worksheet).
Learning Outcomes
Beyond these physical artifacts, the students’ discussions about data were particularly impressive. One group brought up a very interesting question about rare bird sightings and proceeded to debate it for about 15 minutes. They noticed that certain areas of the United States had more overall sightings of rare birds. At the same time, they looked at another data set on the same website showing the number of reporting bird observers across the country. Combining these graphs, they noticed that more rare birds are spotted where there are more reporters. This brought up the question of whether or not rare birds are actually as rare as shown by the data if there is such a close relationship between the two data sets. Both sides of the debate made good arguments and they eventually settled on the idea that the data was still valid, but incomplete. They would need more experiments in order to say anything conclusively. This demonstrates that the learners were in the “data headspace”, thinking about standard questions of representation, outliers, and normalization.
A second group, studying data on arable land, was trying to combine their data set with information on organic farming. This brought up good questions about what the terms “organic” and “GMO” actually meant, as well as whether or not it is related to the ability to reuse land over time. To their surprise, the students did some more research and realized that genetically modified foods and some types of “non-organic” farming actually increase what land can be farmed. Again, the activity pulled the learners into a space where they were curious and driven to understand the real-world approaches and impacts the data might be representing; making sure they understood what they had in front of them before finding a story to tell with it.
Overall, these projects allowed students not just to analyze data to find trends, but to think about why data is important and it can be used to find solutions to problems. Through their mosaics, students explored and discussed different potential solutions to determine which one they wanted to communicate with a larger audience.
The Opportunity of STEAM
Brian’s workshop is a wonderful example of how a creative arts-based approach to working with data can engage and proboke students in novel ways. It matches results we’ve seen in previous work on creating data murals with youth in Brazil, and working with a network of school on data challenges. These workshops are starting to help us build an evidence base for using the arts as an introduction to working with data. This can meet a larger set of students where they are. The physical artifacts and conversations around them are assets we use for evaluation and assessment. Are you an educator? We’d enjoy hearing how you are approaching this.
References
Websites with Environmental Data
- https://www.epa.gov/air-trends
- https://coast.noaa.gov/hurricanes/
- http://www.miseagrant.umich.edu/lessons/lessons/all-data-sets/
- https://climate.nasa.gov/evidence/
- https://feederwatch.org/explore/
- https://data.worldbank.org/topic/environment?end=2014&start=1960
- http://resources.seattlecentral.edu/qelp/Data.html
- https://www.airnow.gov/index.cfm?action=airnow.mapsarchivecalendar

You must be logged in to post a comment.