
Data is hot. That isn’t exactly a radical statement. I doubt I could find anyone to disagree. Unfortunately, using data often disempowers far too many people.
The three phases of data therapy
Most of the work on data right now is happening in the realm of “transparency” – opening up previously hidden data for others to use. I talk about all this work as the first phase of Data Therapy. It is a necessary precursor, but of course not an end in itself.
The second phase of Data Therapy involves taking data and effectively telling a story with it, based on your audience and goals. Most of my Data Therapy work has focused on this phase. I try to assist by identifying techniques for data story-telling and providing case studies to help decide when to use each technique.
The third phase of Data Therapy is about taking data full circle – helping the communities described by the data take ownership of the stories being told. This is why we’re so excited about the Data Mural that just got started!
Excuse me, do you speak data?
The thing is, the second phase (effectively telling data stories) often makes assumptions about data literacy, and ends up disempowering large swaths of the population. As we move into a world where more and more civic decisions are data-driven, those in power are becoming more data-literate. They are becoming more agile with the language of data. This approach can quickly disempower those without any data literacy.
Language has a tradition of being used to deny one class access to empowerment. The Roman Catholic Church resisted an english language bible. Techies (like me) purposefully use technical jargon to stay aloof about our wizardly. Lawyers to this day speak an unidentified language that they spend years learning in special schools!
The thing is, it doesn’t have to be that way. I take two approaches to empowering people with data:
- Present data creatively
- Educate the public in the language of data
Being a graph nerd, I think about this on an axis. One end is “data speak”, the other “regular language”.
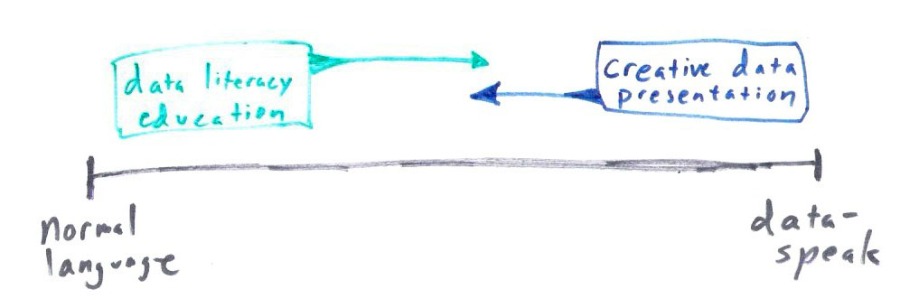
I’m trying to do both. Every data presentation is a trojan horse, holding within its false belly a chance to address the problem of data literacy. We need to be explicit about this if we want to overcome data’s natural tendency to disempower.

3 thoughts on “Data as Disempowerment”
Comments are closed.