I just returned from a fascinating week in Belo Horizonte (Brazil), where we ran multiple workshops to build capacity to work with data in creative ways. The trip was organized by the Office of Strategic Priorities of the State of Minas Gerais (they are members of the MIT Media Lab). This post is one in a series about the workshops we ran there.
As a followup to our large lecture in Belo Horizonte last week, we selected about 50 participants to join us at a hands-on workshop (called “Conecta Mais”). The goal was to introduce a handful of activities that participants could run to empower their communities to find stories, and present, data in creative ways. This was really our first opportunity to do a little training-of-trainers, so we were excited! The event was generously hosted on the top floor of the SEED startup accelerator building.

Content
We planned the agenda to introduce four of our hands-on facilitation activities. We did each for about 15 minutes, shared results with each other for 10, and then reflected together for 10 about how it went, and how participants might use it in their communities.
You can download a handout describing these activities, and how to run them.
Build Data Sculptures
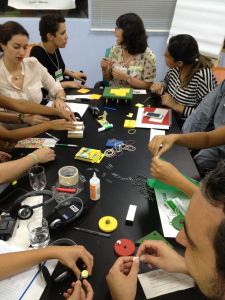
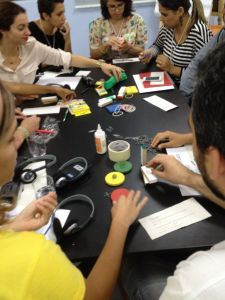
The idea of playing with data is new to most people. This activity lets people quickly build sculptures that tell a simple data story with craft materials. The playful approach to the data helps engage the participants in thinking about how stories can be found and presented quickly and helps people feel more freedom and flexibility about data presentations.
We introduced a tiny dataset and spread out traditional kids craft materials over each table. Participants broke up into teams of 3 or 4 and had 5 minutes to build a quick physical/visual representation of that data using the materials.
Here are some pictures from a previous time we ran this activity.
Remix an Existing Visualization
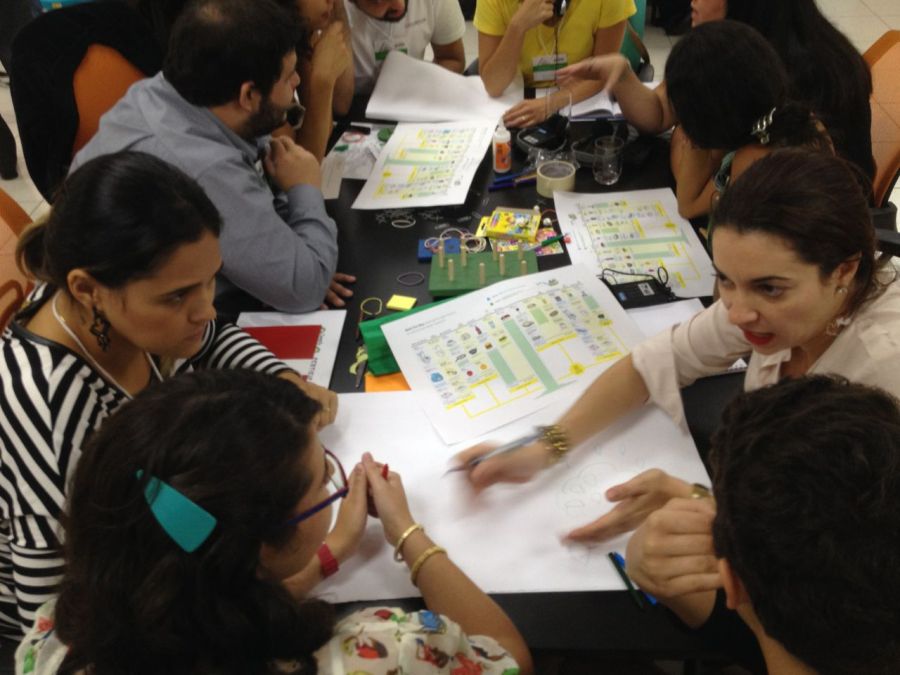
The goal of this activity is to practice the various techniques for presenting data. This gives participants a “toolbelt” of techniques they can use to tell a data story, helping them feel more confident that they can present data creatively.
We introduced an infographic visualization and gave printouts to each group (of 3 or 4). We assigned each group one of the presentation techniques we ran through during the lecture, and gave them 10 minutes to come up with a way to present that same data using a different technique.
Make Some Word Webs
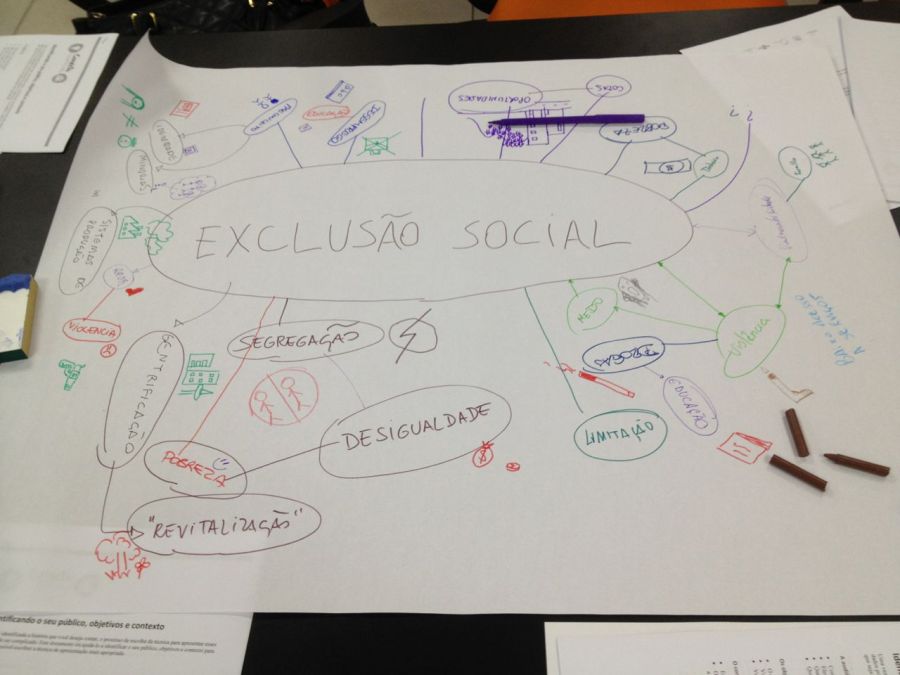
Abstract ideas are hard to picture, and even harder to draw. A word web is a tool for exploring abstract ideas. This activity gives participants a way to turn abstract ideas into concrete images, allowing them to move from numbers to pictures to engage new audiences.
Each group got a big piece of paper and came up with an abstract concept to put in the middle of it (poverty, social inequality, etc). They got 4 minutes to write words on the paper that were connected, and then another 3 to try and draw whatever they could next to the idea.
Make Data Storybooks
Storytelling is an art form, and we don’t get to practice it very much. This activity lets participants practice putting a data story together into a narrative, like a storyteller would. It lets people sketch their story and play with different ways to tell it in a fun storybook form, creating a narrative that can tell their stories in a convincing way.
Each small group received a big piece of paper to fold into a storybook. Each book had to start with “Once Upon a Time…” (ie. “Era Uma Vez…”). Groups got 10 minutes to write and draw a short story about the small dataset we introduced.
Here’s a blog post I wrote about this activity previously.
Group Therapy
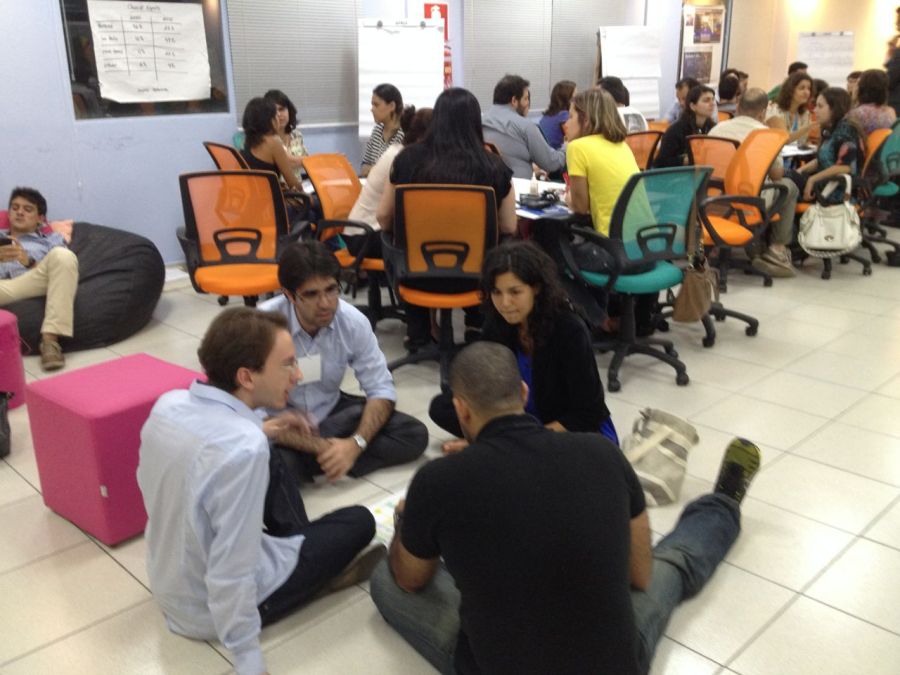
The event closed with some “group therapy” – a hallmark of Data Therapy workshops. We grouped the participants into threes, and then gave each person 5 minutes to share their challenges with data and storytelling with the others. After 15 minute of sharing, each person had 5 minutes to get feedback and ideas from the other 2 for what they might do. We specifically designed this to help build community there in Belo. That room had a lot more expertise than Emily and I, and this was our way of trying to make those valuable connections.
Reflections
This whole event was a bit of a whirlwind. Each activity was more fun than the last as people started to get into the idea of playing with data and stories! The reflection time after each activity was a great feedback for us about how we’ve built these activities, and many comments also pointed to the goals and pedagogy behind their design. I felt like participants really “got it”.
The group therapy time at the end was particularly valuable. After the lecture the night before, many folks came up to Emily and I asking questions about their projects. We realized we hadn’t put time in the agenda for this event to do that, so we moved the agenda around and put the group therapy session back in. Thank goodness, because people did NOT want to stop. We announced the end of the workshop, and no one even moved!
One of the gratifying outcomes for me was that all our hosts at the Escritorio took part in this workshop as well. They dove right in and shared their problems. This kind of active engagement yields the best kind of partnerships.
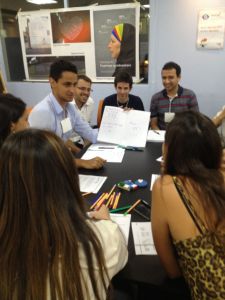
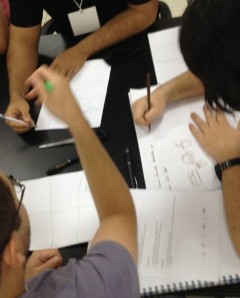
Raquel Carmago posted some pictures on Facebook.

3 thoughts on “A Training on Activities to Play with Data”
Comments are closed.