There are lots of people excited about fancy-pants computer-generated data pictures right now, but I want to remind you that doing things in the physical world can often be more compelling. Externalizing our ideas into real objects gives us something we can interact with and talk around with other people. Here’s a concrete example.
This photo shows a soda bottle filled up with just the amount of sugar in that drink. This is a bit of a classic public health example; most people are surprised at the amount of sugar in a soda. Representing this physically brings home the idea that when you drink the bottle, you’re consuming that amount of sugar. A bar chart would be far less compelling, and you wouldn’t be able to relate to it. This is a simple example, but the underlying concept is clear.
What You Should Do:
Consider whether your data can be brought off the page (or screen). We live in an interactive, three-dimensional, world so you should be creative about bringing your data presentation into it. Surprising your audience with a novel display can engage them long enough for you to tell the rest of your story.
Background Information:
Here’s my standard breakdown of this data presentation:
- Who – group advocating for healthy eating decisions
- Goal – inform the audience about the amount of sugar they consume when drinking a bottle (and possible change their behavior)
- Audience – general public
- Data – photos of things they would like to change, quotes from patients about their experiences
- Technique – “physicalize” the data
- Tools – soda bottle and sugar

Hi Rahul,
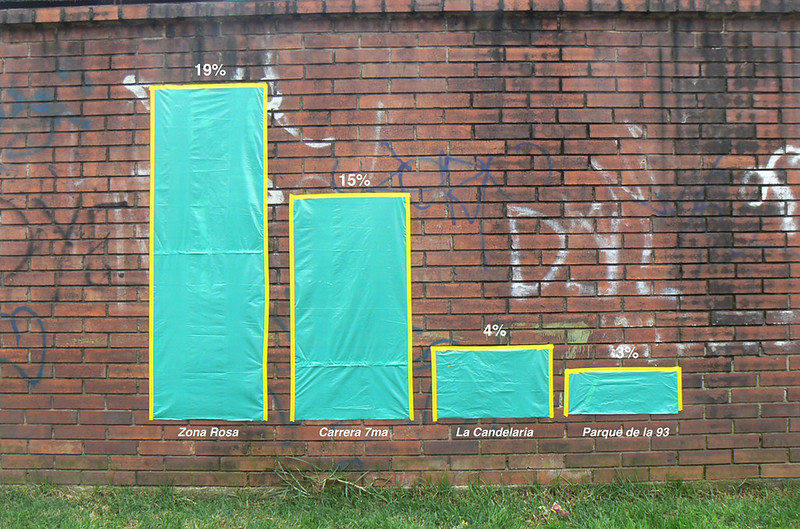
I went to your data therapy presentation at the Guiding Lights conference in Seattle last March and have been sharing a lot of the techniques I learned, including Physicalizeing Data. You showed an example of a graph in a public park/space in the community as an example. I am hoping to find this image to pass along to my organization as we are looking for a unique way to present some community data. Help? I need therapy! 🙂
Michelle
Hello Michelle – that photo is by Jose Duarte. You can see it here:
