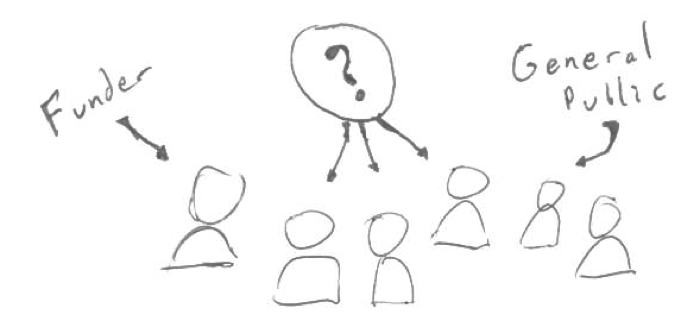
Defining your audience is 90% of what it takes to create an effective data presentation. This is hard to do. Sometimes there are multiple audiences you’re trying to talk to at the same time. One of the key ideas that can help you define your audience is to think about their literacy.
I’m using the word in more than it’s typical “I can read well” kind of way. Here are some questions you should ask yourself:
- How literate is my audience about the issue I’m presenting?
- What pictures or graphs are most appropriate for their visual literacy level?
- How literate is the audience about me and where I’m coming from as a presenter?
The answers to these questions should inform what data presentation technique you pick. When talking about creative data presentation options, a common comment I hear is that some parts of the audience want to see the “real” data – where real means “numbers in a table.” To that I say fine, all well and good. Supply a handout or an appendix that includes the data in tabular form. That lets you please the traditional numbers people, but doesn’t stop you from engaging the rest of us that get bored by long lists of numbers.
What You Should Do:
Flesh out the definition of your audience(s) by thinking about their literacy. Use different and/or multiple techniques based on their background and knowledge. Remember that their literacy will increase as you present, so don’t be complexity-phobic.


2 thoughts on “Audience Literacy”
Comments are closed.