Big Data’s Empowerment Problem

Catherine D’Ignazio and I just presented a paper titled “Approaches to Big Data Literacy”  at the 2015 Bloomberg Data for Good Exchange 2015.  This is a write-up of the talk we gave to summarize the paper.

When we talk about data science for good, collaborating with organizations that work for the social good, we are immediately entered into a conversation about empowerment.  How can data science help these organizations empower their constituencies and create change in the world?  Catherine and I are educators, and strongly believe learning is about empowerment, so this area naturally appeals to us!  That’s why we wrote this paper for the Bloomberg Data for Good Exchange.

Data Literacy

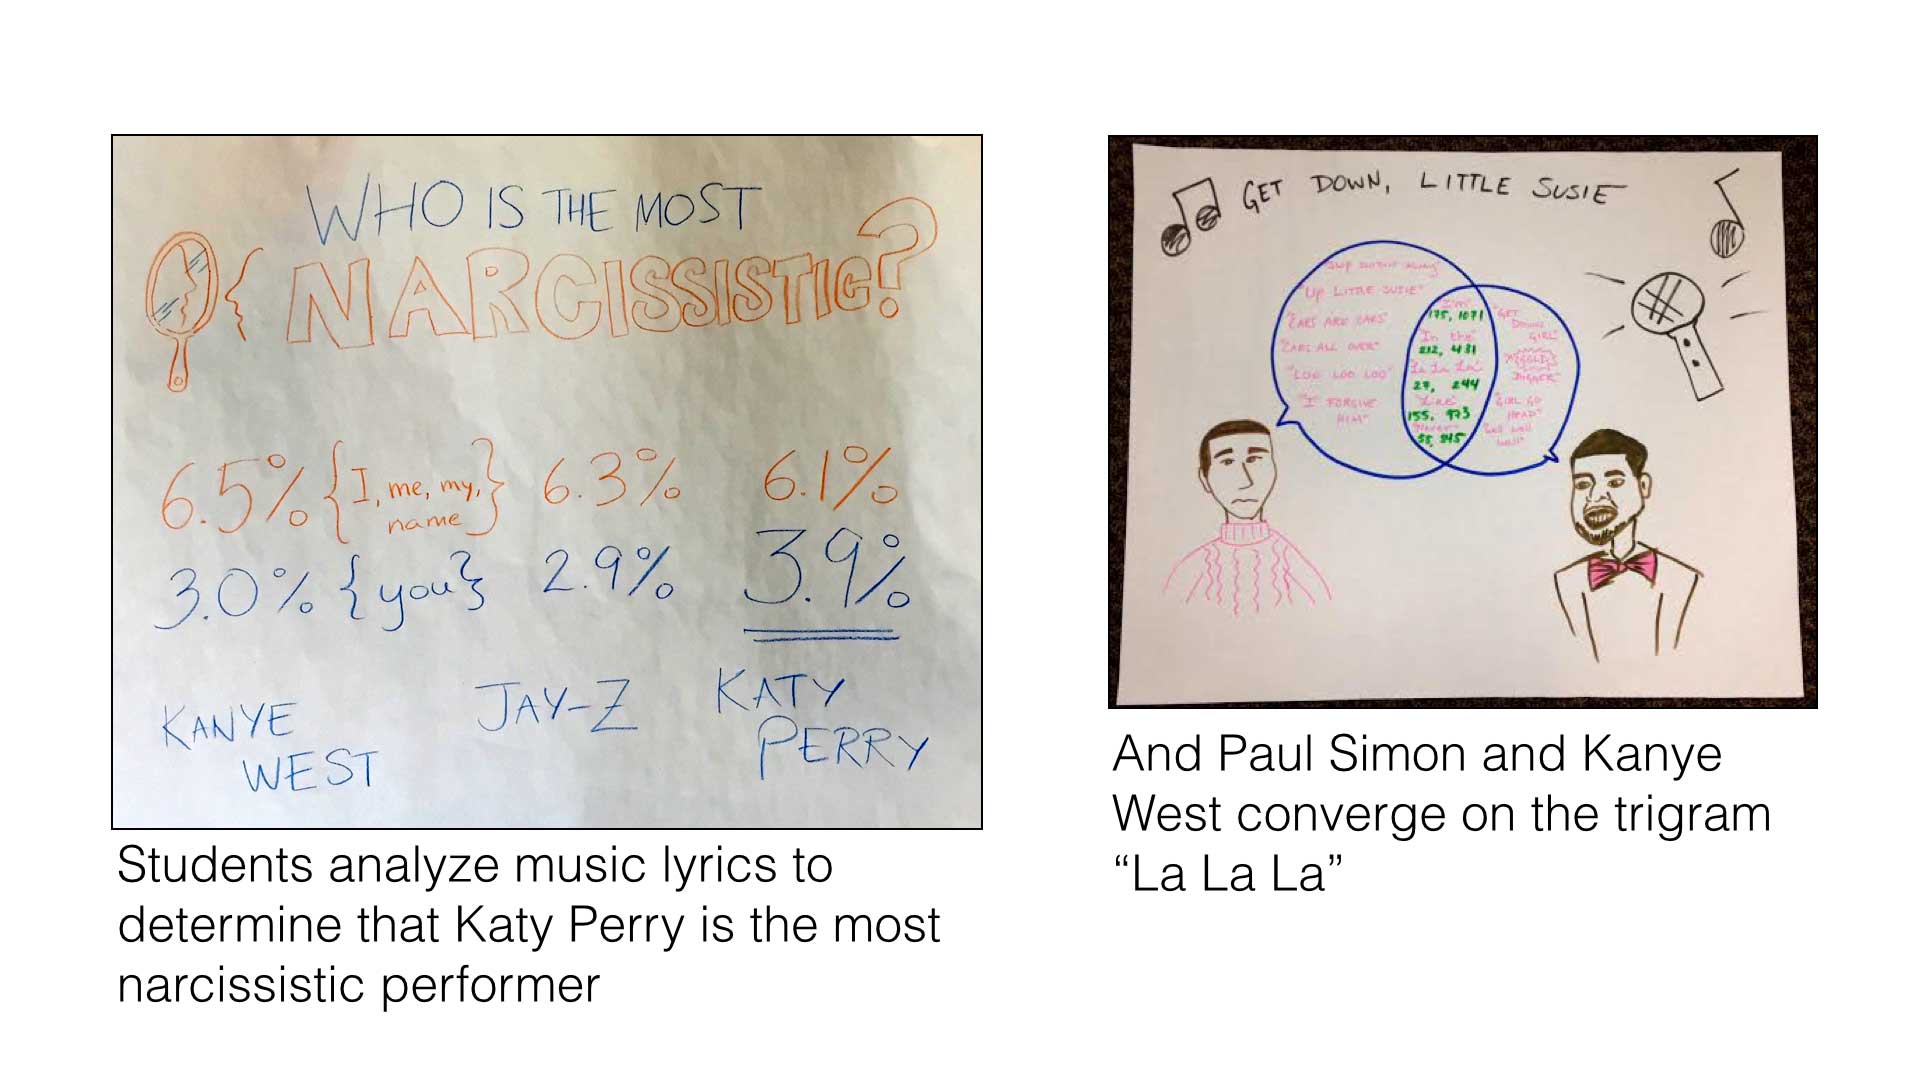
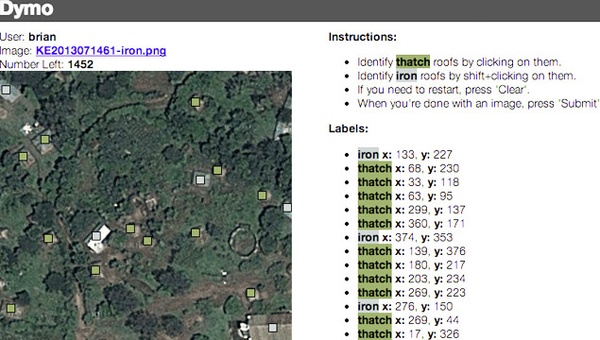
We’ve been thinking and working a lot on data literacy, and how to help folks build their capacity to work with information to create social change.  We define “data literacy” as the ability to readwork withanalyze and argue with data.  So how do we help build data literacy in creative and fun ways?  One example is the activity we do around text analysis.  We introduce folks to a simple word-couting website and give them lyrics of popular musicians to analyze.  Over the course of half and hour folks poke at the data, looking for stories comparing word usage between artists.  Then they sketch a visual to share a story.

Photos of stories created by students showing the artist that talks about themselves the most, and the overlap in lyrics between Paul Simon and Kanye West.

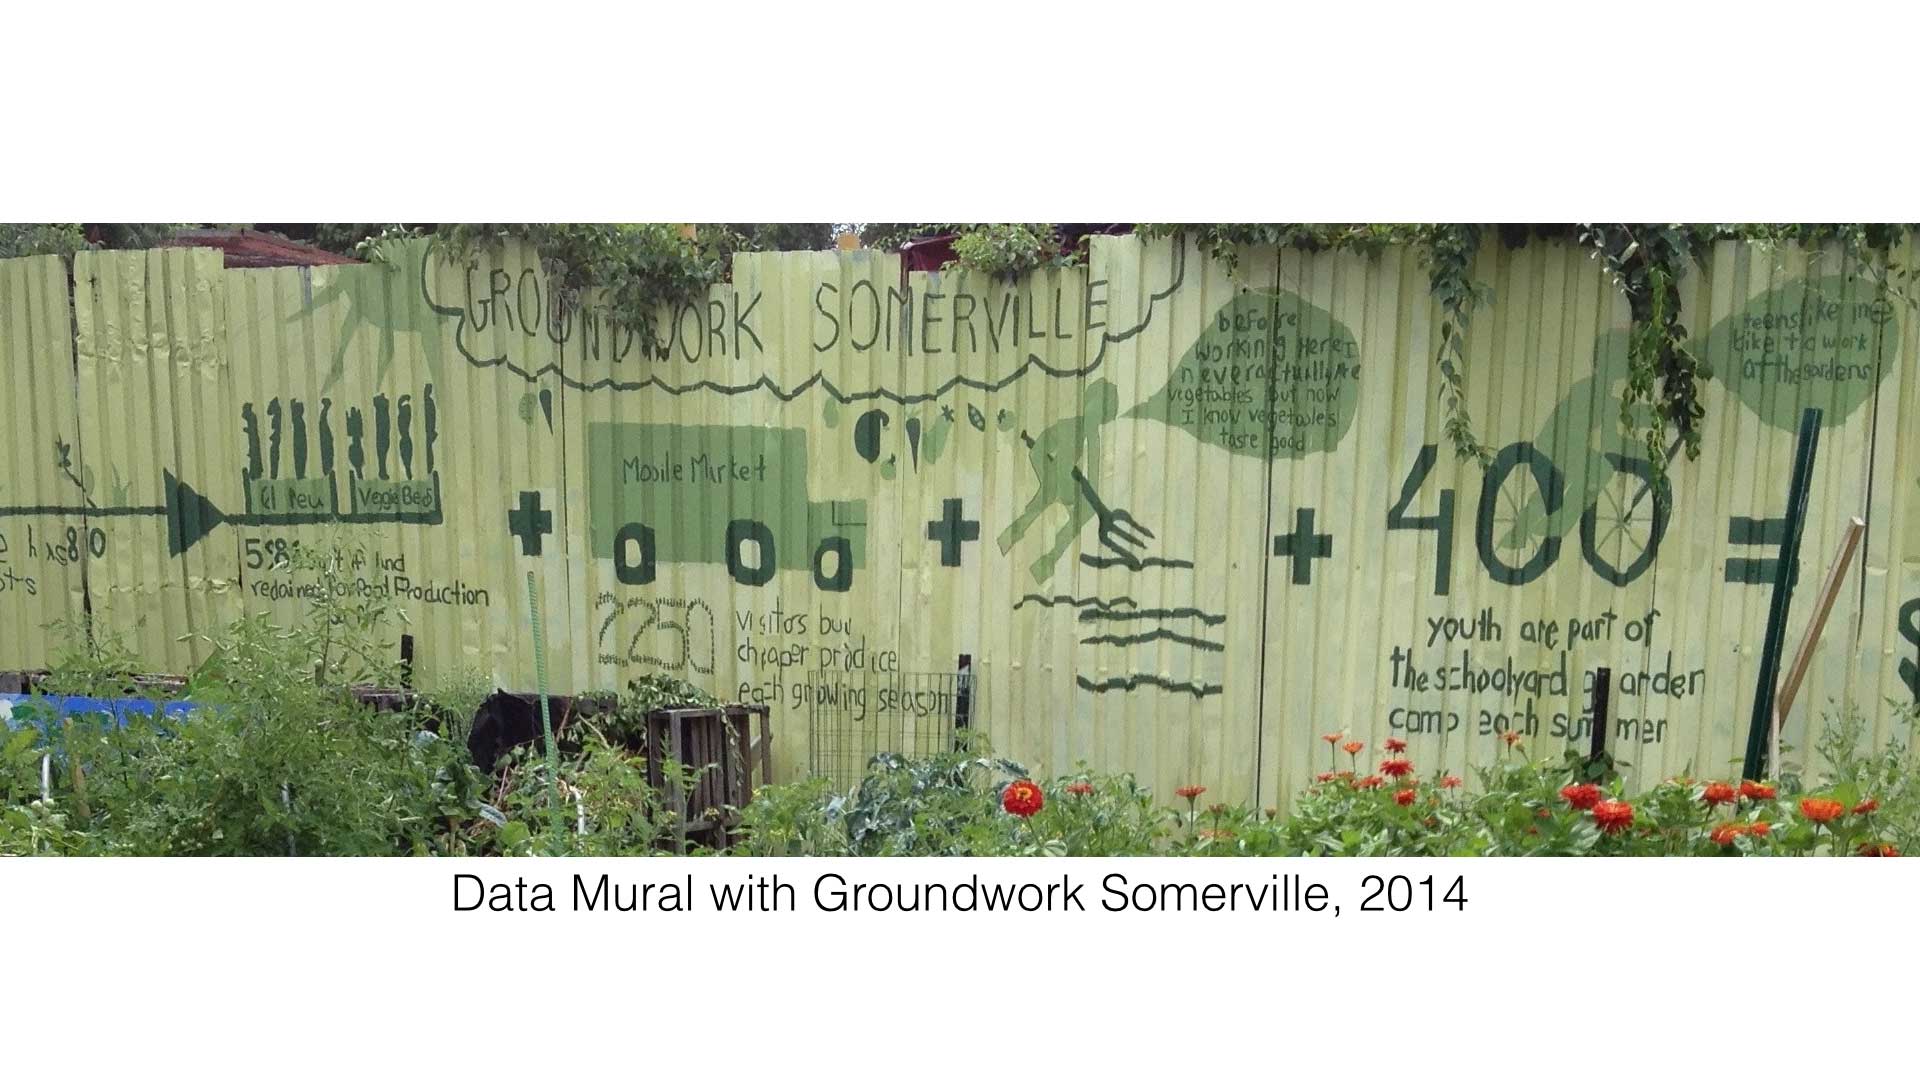
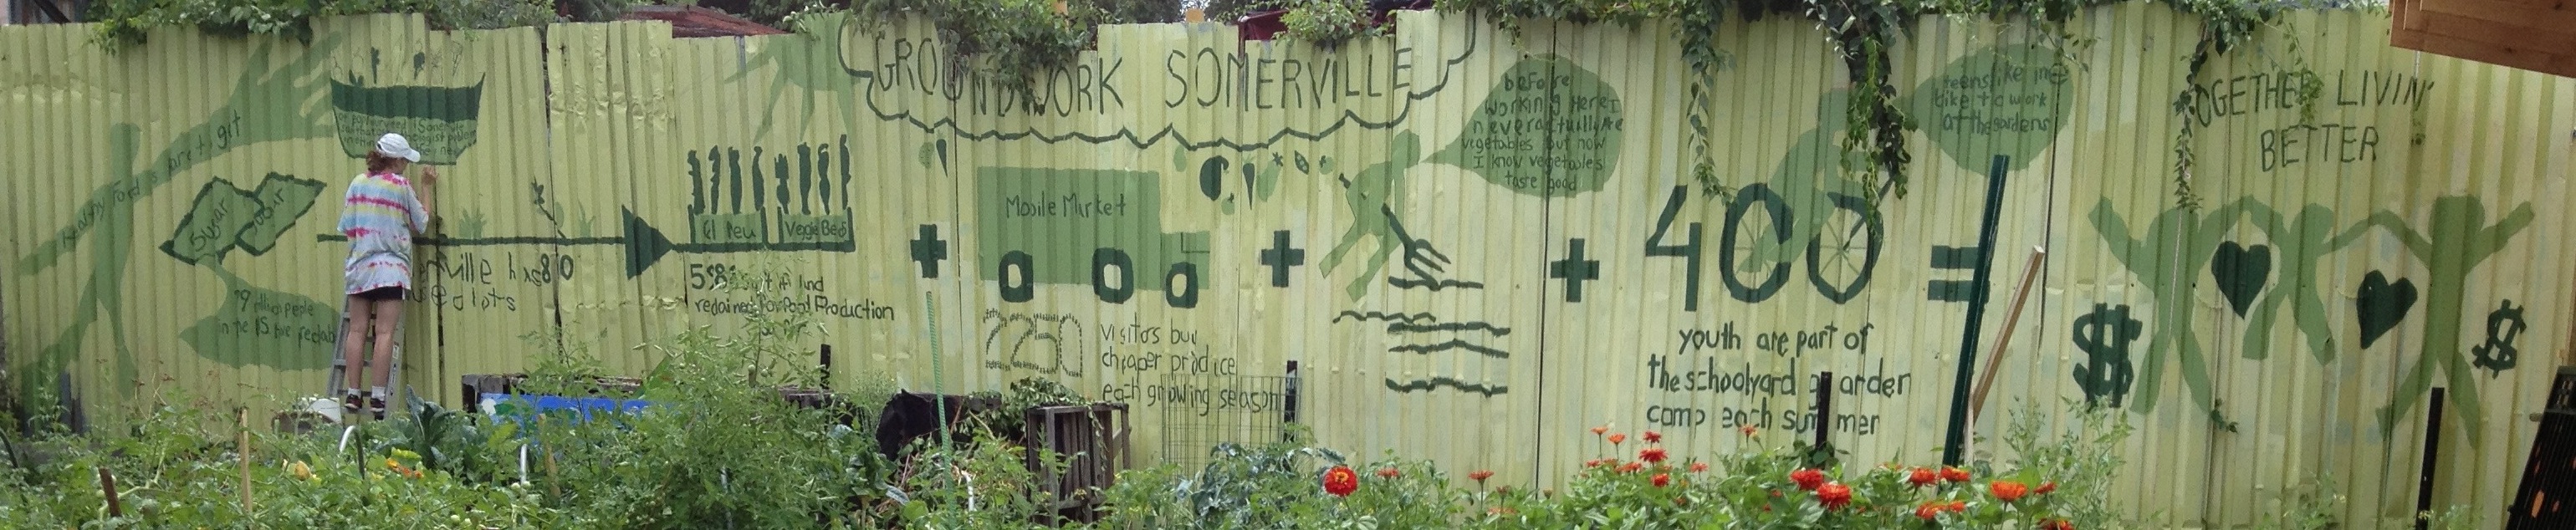
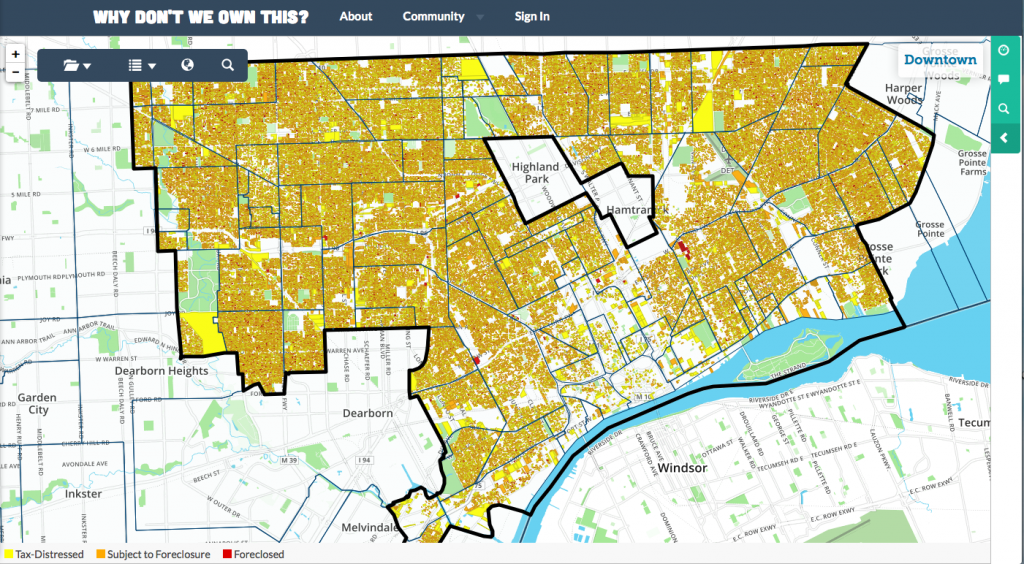
Another example are my Data Murals – where we help a community group find a story in their data, collaboratively design a visual to tell that story, and paint it as a community mural.

The Data Mural created by youth from Groundwork Somerville.

This stuff is fun, and makes learning to work with data accessible.  We focus on working with technical and non-technical audiences.  The technical folks have a lot to learn about how to use data to effect change, while the non-technical folks want to build their skills to use data in support of their mission.

Empowerment

However this work has been focused on small data sets… when we think about “big data literacy” we see some gaps in our definition and our work.  Here are four problems related to empowerment that we see in big data, related to our definition of data literacy:

  • lack of transparency: you can’t read the data if you don’t even know it exists
  • extractive collection: you can’t work with data if it isn’t available
  • technological complexity: you can’t analyze data unless you can overcome the technical challenges of big data
  • control of impact: you can’t argue for change with data unless you can effect that change

With these problems in mind, we decided we needed an expanded definition of “big data literacy”. This includes:

  • identifying when and where data is being collected
  • understanding the algorithmic manipulations
  • weighing the real and potential ethical impacts
Some extensions to define "Big Data Literacy".
Some extensions to our definition of data literacy , to support an idea of “Big Data Literacy”.

So how do we work on building this type of big data literacy?  First off we look to Freire for inspiration.  We could go on for hours about his approach to building literacy in Brazil, but want to focus on his “Population Education”.  That approach was about using literacy to do education and emancipation.  This second piece matters when you are doing data for good; it isn’t just about acquiring technical skills!

Ideas

We want to work with you on how to address this empowerment problem, and have a few ideas of our own that we want to try out.  The paper has seven of these sketched out, but here are three examples.

Idea #1: Participatory Algorithmic Simulations

We want to create examples of participatory simulations for how algorithms function.  Imagine a linear search being demonstrated by lining people up and going from left to right searching for someone named “Anita”.  This would build on the rich tradition of moving your body to mimic and understand how a system functions (called “body syntonicity“).  Participatory algorithmic simulations would focus on understanding algorithmic manipulations.

Ideas #2: Data Journals

Data can bee seen as the traces of the interactions between you and the world around you.  With this definition in mind, in our classes we ask students to keep a journal of every piece of data they create during a 24 hour period (see some examples).  This activity targets identifying when and where data is being collected.  We facilitate a discussion about these journals, asking students which ones creep them out the most, which leads to a great chance to weigh the real and potential ethical implications.

Ideas #3: Reverse Engineering Algorithms:

We’ve seen a bunch of great work recently on reverse engineering algorithms, trying to understand why Amazon suggests certain products to you, or why you only see certain information on your Facebook.  We think there are ways to bring this research to the personal level by designing experiments individuals can run to speculate about how these algorithms work.  Building on Henry Jenkin’s idea of “Civic Imagination”, we could ask people to design how they would want the algorithms to work, and perhaps develop descriptive visual explanations of their own ideas.

Get Involved!

We think each of these three can help build big data literacy and try to address big data’s empowerment problem.  Read the paper for some other ideas.  Do you have other ideas or experiences we can learn from?  We’ll be working on some of these and look forward to collaborating!

Announcing DataBasic!

I’m happy to announce we received a grant from the Knight Foundation to work with Catherine D’Ignazio (from the Emerson Engagement Lab) on a new suite of tools called DataBasic!  Expect to see more here as we build out this suite of tools for Data Literacy learners over the fall.  Follow our progress over on DataBasic.io.

Knight_Prototype_Fund_-_Knight_Foundation

We propose to create a suite of focused and simple tools for journalists, data journalism classrooms and community advocacy groups. Though there are numerous data analysis and visualization tools for novices there are some significant gaps that we have identified through prior research. DataBasic is designed to fill these gaps for people who do not know how to code and provide a low barrier to further learning about data analysis for storytelling.

In the first iteration of this project we will build three tools, develop three training activities and run one workshop with journalists and students for feedback. The three tools include: (1) WTFcsv: A web application that takes as input a CSV file and returns a summary of the fields, their data type, their range, and basic descriptive statistics. This is a prettier version of R’s “summary” command and aids at the outset of the data analysis process. (2) WordCounter: A basic word counting tool that takes unstructured text as input and returns word frequency, bigrams (two-word phrases) and trigrams (three-word phrases) (3) TuffyDuff: A tool that runs TF-IDF algorithms on two or more corpora in order to compare which words occur with the most frequency and uniqueness.

Data, What is it Good For?

I recently led a short session at the inspiring Southern Poverty Law Center called “Using Data to Create Change: Real World Examples”.  Here is a short write-up of some of the examples I shared.

The hype around data has reached such heights that it is in danger of going into low-earth orbit! Being drenched in stories about the potentials for data to change your organization and your work, it is sometimes hard to pick apart the motivations and reasons to using data.  Unlike my blog title suggests, I’m not here to argue that data is good for “absolutely nothing”. I like to look at data as an asset for your organization, but focus in and talk about how it can help you in three concrete ways:

  • You can use data to improve internal operations
  • You can use data to spread the message
  • You can use data to bring people together

Here are four short stories to help pick these apart.  I live and work here in the US, so these case studies are all American.

Designing a Mural

Groundwork Somerville is a organization that works in my hometown here in Somerville, Massachusetts in the US.  One of their big projects involves reclaiming unused urban lots and helping youth build and maintain raised beds to grow vegetables.  They then sell these vegetables at cheap prices from a mobile market that visits multiple local sites weekly. For those of you in other countries, this is a big problem here in the US, where unhealthy food is generally far cheaper than healthy fresh food.

Created by Growndwork Somerville (August 2013)

To build skills in their youth programs, share their work, argue for more support, and have fun, we worked with local youth to design and paint a Data Mural.  They looked at the urban landscape, quotes from youth in the program, public health data, and participation in the mobile market to craft a story and mural speak to the internal and externals impacts the program has.

We used this kind playful engagement of data to bring people together and spread the message.

Using Metrics to Drive Engagement 

Here I’m going to retell a story that is often pointed to, most succinctly in Beth Kanter’s Measuring the Networked Nonprofit.  This is the story of how online news site Grist.com uses social media metrics and other data to move people up their ladder of engagement.  Grist tries to bring a light, playful, and new framing to issues that are important to folks who care about the environment. Folks that might not self-identify as “environmentalists” per say.

5981701957_534d51bac6
The Grist.org ladder of engagement

Grist does deep dives into their web and social metrics to understand what is important to their readers from a short-tem and long-term point of view.  They try to respond to these interests with editorial decision-making and sometimes in near-realtime content generation. Grist uses a strong ladder of engagement to prompt people to engage and own the narratives of stories about environmental issues, knowing that that will make them more likely to act to solve problems.

This attention to metrics and constant checks of their ladder of engagement is a great example of using data to improve internal operations and spread the message.  Read more about this in the book Measuring the Networked Nonprofit (by Kanter and Paine).

Creating Insights and Action

Their third story I want to share is about a small company in Detroit called LoveLand Technologies.  Over the last few years Detroit has been a city in crisis, recording record foreclosure rates, stuck with barely functioning public utilities, and having to file for bankruptcy protection.  In this context LoveLand stared making some simple maps of property in tax-related distress and foreclosure.  These were maps of people losing their homes.

The LoveLand map of foreclosures in Detroit (circa 2014)

Before they knew it, their maps were being used in a variety of unforeseen ways. Government officials were relying on them as the data source of record.  Churches were using them to raise funds for their neighbors in need.  Folks with deep pockets were ready to give them money to do even more work around urban blight in the city.

Their data was being used to improve internal operations, spread the message, and bring people together!  If you want to learn more read Ethan Zuckermen’s liveblog of a talk Mike Evans did recently at the MIT Center for Civic Media.

Guiding Program Decisions

My last story is the most high tech. It comes from DataKind, and organization that pairs data scientists with nonprofits to think through and implement projects focused on data analysis.  GiveDirectly started working with DataKind to get help targeting their unconditional cash transfers to those the money could help the most.  They’re a very data-centric organization already, so working with DataKind volunteers on some advanced topics just made sense!

GiveDirectly-600x340
A screenshot of their UI identifying roof types from satellite images (from the DataKind blog)

Data scientists Kush Varshney and Brain Abelson worked with GiveDirectly to understand how satellite imagery could be analyzed by computers to identify areas where aid funds would best be directed.  Based on the existing research showed a strong correlation between a villages wealth and the number of iron (vs. thatch) roofs, they created an algorithm that attempts to count iron and thatch roofs in satellite imagery. It is important to note that it doesn’t quite work yet, but it is important to think about novel applications for data mining that can create new types of data to help your work. Hopefully they can continue to tune the algorithm to improve their results and turn into a useful tool.

This analysis and tool building is trying to improve internal operations so GiveDirectly can do their work better.  Watch their technical talk to learn more.

Wrapping Up

There are just a handful of my favorite stories to illustrate the variety of ways you can use data to help you make change in the world.  Are their counter-examples illustrating the perils and pitfalls of using data in any of these ways.  Of course. I strive to highlight those stories just as often… but that’s a list for a different blog post!  I hope these four help you start to think about creative and new ways your organization might be able to turn all the data hype into something useful.

For reference, here’s a link to the presentation that went along with this talk:

Screenshot_7_26_15__5_42_PM

Architectures for Data Use

This is a summary of one section of my workshop on Data Architectures at the SSIR Data on Purpose workshop.

Data can be used for a variety of things.  In thinking about setting up architectures for data use within your organization, you need to focus on two main questions:

  • Does the data we have align with our goals?
  • How can we use data to further our mission?

Alignment with Your Goals

People see data everywhere now, and get overly excited about it. When you think about using data within your organization, you have to return to the roots of what your organization is all about and make sure the data is in alignment with that.

There are a few common patterns organizations fall into when using data. First, many collect data simply because it is easy to collect, without considering whether and how it can be used.  Second, many tend to focus on quantitative over qualitative data, when in fact the strongest arguments are often made using both.  You have to understand what kind of data you have before you can use it effectively:Data_Architecures_Workshop___SSIR_Data_on_Purpose

All these types of data need to align with your goals.  You can use data in a wide variety of your efforts, from inspiring more activism to changing behavior.  The key piece is your use of data must support those activities.

Using Data to Further Your Mission

Your data is not an end in itself.  It is an asset you can use to do your work more effectively.
Data_Architecures_Workshop___SSIR_Data_on_Purpose


You can use data in lots of ways to further your mission.  Three quick examples:

  • improve operations: you can monitor engagement on social media campaigns
  • spread the message: you can use data in your communications materials to advocate for change in new ways
  • bring people together: you can gather around the data to find stories (and paint murals)

Of course there are loads of other things you can do as well. The key here is that This framing encourages you to be goal-centric, rather than technology-centric (which is a big danger when working with data). You don’t want to get lost in the hype around the latest and greatest tools. That approach does help you advance your mission. A beautiful external-facing infographic that doesn’t fit into your ladder of engagement, or includes no call to action, is useless.  A dashboard showing key indicators doesn’t mean much if they aren’t the right key indicators.

I hope this quick intro helps ground some of the hype out there around data use, and help you figure out what architectures to support for data use within your organization.

Architectures for Building a Data Culture

This is a summary of one section of my workshop on Data Architectures at the SSIR Data on Purpose workshop.

Organizations all around the world are asking themselves how to build a data culture within their walls.  Of course, this means something different for each of them.  However, I want to introduce you to my process for answering that question.  I rely heavily on Beth Kanter’s amazing work in this space, specifically her book Measuring the Networked Nonprofit (co-written with KD Paine).

There are three guiding questions you can use to lead you through this process. I’ll go into each one in detail in this blog post.

  • What is a data culture?
  • What is our existing data culture?
  • How do we build a data culture?

What is a Data Culture?

data-what

First off, it is important to define what a data culture means to you.  We toss around a lot of phrases to tease that out, so I find these little comics illustrative of the differences between some of these labels.

  • We you’re data-centric, you bring people together around data as the central driver to help make decisions
  • When you’re data-informed, you take the data and it’s context as inputs to your conversation and decision make process
  • When you’re data-driven, you look at the data to find out what to do or how to approach something

Sure, these are kind of caricatures of those terms, but they’re helpful.  As with most things, I like Beth Kanter’s description of some of these differences.  Not surprisingly, I agree with her and advocate that organizations take a data-informed approach.

What is Our Existing Data Culture?

Before coming up with a plan for building the data culture you want to see in our organization, you have to understand the culture that is already there.  Looking internally at your organization structures and practices can feel tiring, but it is a necessary time to put on your anthropologist hat.  Here are some questions that might help:

  • Are there data champions already using data in good ways that you can celebrate as models to duplicate?
  • Are the roles in your organization aligned with your data needs?
  • Is there a central person setting policies and best practices when it comes to your data-related work?
  • Do you have a data group? A Chief Data Officer? A Data Scientist?  Or are those labels too much for your small organization?
  • Who owns the data being collected, and do they have incentives to share it across the organization?

How do we Build a Data Culture?

Changing the internal culture of any organization is slow work.  Beth’s crawl-walk-run-fly model (borrowing from the MLK quote) is a fantastic approach to this.

cwrf-kanter
slide from Beth Kanter, used here with her permission

She is, of course, focused on internal processes and measurement for social media (that’s what she does), but the approach is valid for various types of data work.  There are a multitude of strategies she suggests for building this kind of culture:

  • look for internal advocates / experts
  • look for key exemplars
  • build external relationships
  • lead from the top and from below
  • baby steps are ok

Seriously, just go buy and read the book already.

Pitfalls

Of course, there are dangers and barriers you will have to overcome.  First off, remember that people tend to measure what is easy to measure, not necessarily what is important to measure.  The way to overcome this is to create a critical data culture that constantly asks questions like “what does this data help us do?” and “what is missing from this data?”.  Another common barrier is organizational fiefdoms that don’t want to share their data with other.  You can respond to this by incentivizing sharing of data and highlighting examples that do.

There will be other challenges on your path to building a data culture, but remember your goal.  Data-informed decision making and communication has already emerged as a key skill you need to have to help you create the change you want to make.  You need to build a data culture within your organization to advance your work. I hope these tips help!

“Tidying” Your Data

Recently I’ve been giving more workshops about cleaning data.  This step in the data cycle often takes 80% of the time, but is seldom focused on in a systematic way.  I want to address one topic that keeps coming up – what is clean data?

When I ask, I usually get answers all over the map.  I tend to approach it from four topics:

  • consistency: are observations always entered the same way?
  • completeness: do you have full coverage of the topic?
  • usability: is your data human readable, or machine readable, in the ways you need it to be?
  • atomicity: do the rows hold the correct basic units for your analysis?

The last topic, atomicity, is one I need a better name for.  In any case, I want to tease it apart a bit more because it is critical.  Wickham’s Tidy Data paper has a great way of talking about this:

each variable is a column, each observation is a row, and each type of observational unit is a table

Yes, someone wrote a whole 24 page paper on how to make sure your columns are right.  And yes, I read it and enjoyed it.  You should go read it too (at least the first few pages). The key point is that far too many tabular datasets have column headers that are, in fact, part of the data.  For instance if you are keeping track of how many times something happens each year, each year shouldn’t be a column header; “year” should be a column and you should have one row for each year.  For you excel junkies, this means your raw data shouldn’t be in cross-tab format.

This process of cleaning your data to make it tidy can be annoying, buy luckily there are tools that can help.  Tableau has a handy plugin for Excel that “reshapes” your data to prep it for analysis.  If you are an R wizard, here is a presentation on how do tidying operations in R.  If you use Google Sheets, there is a Stack Overflow post that has some details on a plugin someone wrote to normalize data in Google Sheets.

I hope that helps you in your next data-cleaning task.  Hooray for tidy data!

Architectures for Data Security

This is a summary of one section of my workshop on Data Architectures at the SSIR Data on Purpose workshop.

Data security is a tricky concept for for organizations large and small.  In this post I’m going to lay out how I approach helping these groups come up with a comprehensive strategy that meets their needs.

Core Questions

There are a few questions you need to ask yourself before you can think about what security means for data and organization:

  • what does security mean for us?
  • what level for data security is right for us?
  • what kind of protections do we need in place?

These focus as much on technological solutions as social processes.  Security is fraught with problems, and I’m by no means an expert.  However, I want to share some frameworks that might help you get started.  I’ll use two ways to think about security – access and longevity.

Access as a Security Issue

Most folks approach security from this perspective.  Who is allowed to add, see, and manage the data?  You can think about four issues within this:

  • technical vulnerabilities – This is about software and hardware systems you put in place to protect your data.  Can your systems be broken into?
  • social vulnerabilities – This issue about about how the social dimension of people can create problems for security.  How can someone be tricked into giving their key that gets past the technical defenses?
  • external threats – This issue is about the classic model definition of someone “hacking” into your systems to get your data.  You need to understand who the threats might come from, and how they might try to get in.
  • internal threats – This is about understanding your organization.  What’s the risk that someone inside your organization will, due to ignorance or malice, give out some of your sensitive data?

The conversations tend to revolve around technical vulnerabilities from external threats… so I’ll focus on the opposite.  You need to remember that sometimes your data can get out by accident!

For instance, the Basecamp project management software had an accidental leak a few years ago. They wanted to celebrate their 100 millionth file upload so one of their staff shared the name of the file.  That might, at first, seem innocuous, however this symbolic release of information that should be private led to outrage from their community of users. If they released this simple filename, what might they release next?  This social vulnerability form an internal staff member created a serious breach of trust.  You need to think about these less-commonly considered security issues to really understand what security means for you.

Longevity as a Security Issue

Working with social change organizations, I find it is useful to remind folks that data has a lifespan.  The longevity of your data is a big security issue that you need to consider.  Who manages it in the long term?  What are your commitments to honor data retention and access policies over time? You need to consider:

  • secondary uses: What future uses might your data lend itself too?
  • data validity: Is the time of your data collection clear?  What should people who try to use it in the future be aware of?
  • data integrity: Does your data change over time?  Do you have a way to tell when it was last updated?  Are you clear about its context?
  • data ownership: Who owns your data? Is there a period of time after which you plan to release it? What happens to it if you organization disappears?

Here’s an example: a 1980s research paper looked back at the archives of the 1964 Freedom Summer project.  The researchers looked back at the enrollment forms for the people who volunteered to try and determine what the best predictors of participation were.  This kind of re-use of data 20 years after the fact is the kind of usage you need to consider.

Policies & Practices

So how do you craft policies and put them into place.  The key consideration is that they need to match your needs.  You have to take stock of the existing patterns people have and try to accomodate and build off of them.  It’s best to engage the key players in your data’s lifecycle early, so they have ownership of the system you put in place.  This “meeting people where they are” approach doesn’t mean you can’t create a strict policy about data use, but it does create an environment where your policies are more likely to succeed.


Paper on Designing Tools for Learners

On an academic note, I just published a paper in for the Data Literacy workshop at the WebSci 2015 conference.  Catherine D’Ignazio and I wrote up our approach to building data tools for learners, not users.  Here’s the abstract, and you can read the full paper too.

Data-centric thinking is rapidly becoming vital to the way we work, communicate and understand in the 21st century. This has led to a proliferation of tools for novices that help them operate on data to clean, process, aggregate, and vi- sualize it. Unfortunately, these tools have been designed to support users rather than learners that are trying to develop strong data literacy. This paper outlines a basic definition of data literacy and uses it to analyze the tools in this space. Based on this analysis, we propose a set of pedagogical design principles to guide the development of tools and activities that help learners build data literacy. We outline a rationale for these tools to be strongly focused, well guided, very inviting, and highly expandable. Based on these principles, we offer an example of a tool and accom- panying activity that we created. Reviewing the tool as a case study, we outline design decisions that align it with our pedagogy. Discussing the activity that we led in aca- demic classroom settings with undergraduate and graduate students, we show how the sketches students created while using the tool reflect their adeptness with key data literacy skills based on our definition. With these early results in mind, we suggest that to better support the growing num- ber of people learning to read and speak with data, tool de- signers and educators must design from the start with these strong pedagogical principles in mind.

Architectures for Data Storage and Management

This is a summary of one section of my workshop on Data Architectures at the SSIR Data on Purpose workshop.

Data management and storage is a problem for organizations large and small.  In this post I’m going to lay out how I approach helping these groups come up with a comprehensive strategy that meets their needs.

Core Questions

There are a few questions you need to ask yourself before coming up with a plan for storing and managing your data:

  • how do I make it easy to add, find, and use data?
  • what processes will help us organizing and manage our data?
  • what tools can we use to support managing our data?
  • what is the appropriate level for my organization?

These focus as much on technological solutions as social processes.  You need to understand what does and doesn’t work already within your community before making a plan to move forward.

Goals

What criteria does a good solution need to meet? Here is an outline of how I approach this:

goals

  • organized: your data should be stored in a consistent structure (often this tends to reflect the structure of your organization)
  • described: your data needs to be documented formally or informally (this can include anything from a sentence to formal meta-data, and should include notes on how it was created)
  • accessible: your data should be available for people to use (this could be on a shared file-server, an online portal, a data management system… and should be easy to add to)
  • usable: your data should be stored in a language your organization speak (this could be spreadsheets, databases, or should follow any standards for format that exist in your area)

Techniques

So how do you think about the space of available solutions?  I tend to think about solutions in two ways (based on goals above) – how organized & described they are, and how usable & accessible they are.  For instance, having standardized spreadsheets stored on individual staff’s computers is very organized, but not very accessible at all!  Here’s a chart that tries to map some of the solutions against these two axes:

solutions

This map can be helpful to help figure out where you are, and where you want to be.  It isn’t necessarily the case that you need to be in the top right of this chart (ie. very organized and very accessible)… you need to figure out what is right for your organization.

There are lots of specific technologies that can help in this space.  I’m not in the business of endorsing specific packages, but here are some I see other folks using:

  • A shared internal file server (sharepoint) or external sharing service (dropbox) can be helpful to get all your data in one place and expose it to everyone.
  • An online data portal can help you collect, organize, and share your data internally and externally.  Lots of cities around where I live use Socrata.  Many of the mid-sized organizations I have worked with use the open source ckan project.
  • If you are focused on helping people access your data with software APIs and/or code, or need strong support for versioning your data, look for online platforms like GitHub.

Obviously the solutions that are right for you need to fit your data and topic – if you work on sensitive issues of personal data, you need to be especially sensitive to understanding where these online platforms store your data and how they might back it up.

Getting Started

I hope this is helpful scaffolding to help you think about what architectures for data management and storage can help.  This stuff can be boring, but it is critical infrastructure to get in place to support building a strong data culture within your organization!  Start with these questions:

  • what data language does our organization speak already?
  • how is our data organized right now?
  • what needs must any solution we use meet?