
Developing a Collective Curriculum to make Civil Society Date Literate
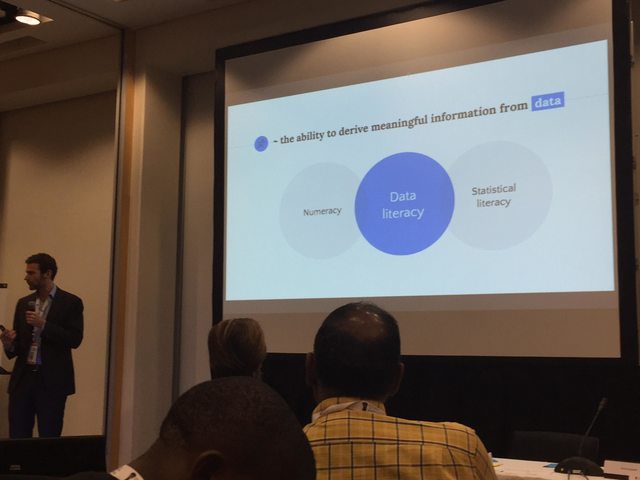
Pim argues that making data meaningful requires interpretation. TO do this, people need to be data literate. They begin by sharing a number of examples trying to demonstrate this. For instance, news stories gloss over the important difference between correlation and causation is not grasped by most. Another discussed how to do regression correctly. These examples argue for the ability to derive meaning information from data.
Brainstorming
The goal of this workshop is to develop a collective curriculum to make civil society more data literate. After a quick poll of the room, we can see that the room is a mix of policy advisors, statistical bureau staff, NGO workers, educators and more.
Pim Bellinga and Thijs Gillebaart run I Hate Statistics. Their goal is to make statistics sexy again. They started this because many of thier friends were working on topics that required statistical work, but didn’t want to do it. As teachers, Pim found a need to build a tool to study online to meet individual student needs. These online activities are then a measurable assessment tool for building data literacy. “This is the first time I get to feeling I am understanding statistics” said one student. In general courses that use their tools see pass rates go up. The are using this in universities across the Netherlands.
In addition to university students, they want to serve civil society anyone that reads something that is based on or contains data. Pim asks when civic society might engage with the SDG data. A few audience responses:
- In media when trying to tell a story about the current state of affairs we could use SDG data.
- In governemental burueaus we can use the SDG data to make recommendations
- In advocacy, we can use the SDG data to hold the government accountable.
- Organizations can align their strategies to what the data say.
Pim asks who should become more data literate. We break into small groups to brainstorm groups which you think should be more data literate.
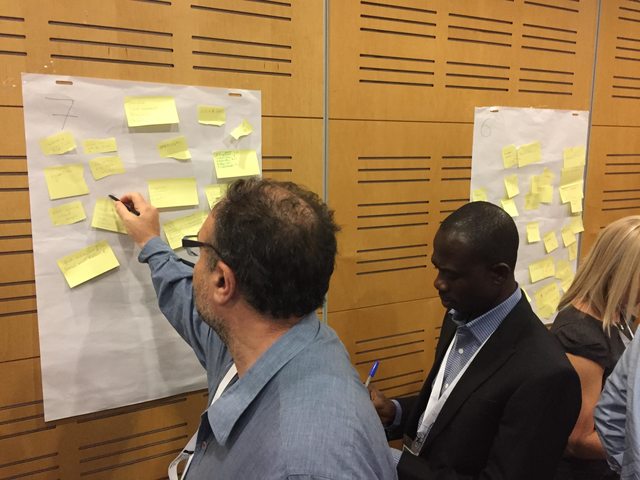
After 10 minutes of grop brainstorming, Pim then asks us to think about 3 top categories – journalists, students and educators, and policy makers. We split into three large groups to think about what these audiences need to know. What specific skills or abilities do they need? We breakout again to discuss. The goal is to end up with a draft curriculum of how to build data literacy in each of these sectors.
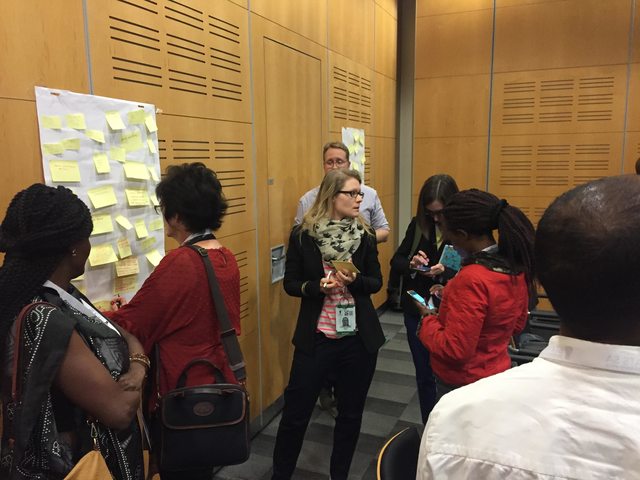
Thijs visited each of the groups to look highlight a few of the specific abilities they came up with.
How I Hate Statistics Approaches Building Data Literacy
How does I Hate Statistics think we can best teach these skills at scale. Explanations should be short, relevant, and at the right place. Doing it online is a part that can help; it isn’t the whole solution. You can teach people at their own pace and time. You can use visuals, interactivity and stories – these are ingredients.
A guest comes up ot review a collaboration. She works for a membership-driven online journalistic platform. One of the topics covered is when and why polls can be helpful or hurtful. They are collaborating on that topic with I Hate Statistics on this.
Representation is one issue to pay attention to with polls, as are error margins. Journalists report poll changes that are within the error margin. I Hate Statistics is using the ingredients mentioned to build an interactive that conveys these issues to journalists. In three months there will be elections in the Netherlands, so this is relevant.The interactive simulates a random sample of vote polling. Comparing this to actual results shows that sampling can produce very close results to the actual. Their next step is to show a number of runs of sampling, each of which produces slight deviations. These are called the “error margins”. They hope this helps journalists learn that changes within the error margin don’t deserve big headlines. This is an example of a short interactive explainer, that attacks one part of how to become data literate.
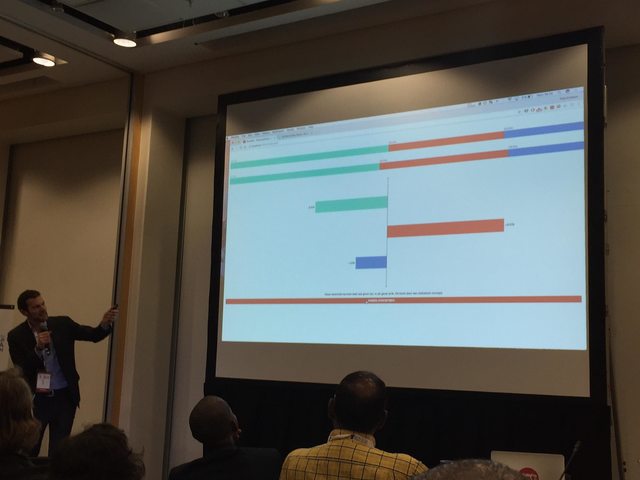
Journalists are asking for data literacy education. They have developed visual stories, one example of which is a manager delivering organs to people who need them. The need to decide between two routes. The manager suggests using GPS data to figure out which route is faster. This brings in raw data. Students start by summarizing to get insights. Looking at the mean and mediam shows route 1 being faster in both. They choose route 1 and all the drivers take it.
Two or three weeks later, they get a call that the drivers delivered the organ too late. In fat after the decision there have been many more too-late deliveries. Going back to the raw data, charting a histogram shows that the spread was bigger on route 1, meaning there were many more late deliveries even thought the medan and median showed it lower. Variation is as important a summary as mean/median.
These types of stories can motivate people to think about statistical data.
Q & A
Let’s not forget secondary impacts. For instance, what about the driver’s attitude when taking route 1; like perhaps it is the highway and more stressful. How do we measure and respond to that?
We should try to influence people’s behaviors.
The two examples are short interactives. Coherence and transparability are two important ideas – how do we bring those in? Perhaps a next module could ask those questions? This could get into questions like “how is the data collected?”. How can your short segments help people increase their understanding?
This is a great question and challenge. Super short lessons are necessarily neglecting some things. We need to connect these short ideas together so they become a curriculum.
We can’t build one collective curriculum for everyone. We have to adapt the bits and pieces that exist to each target group.

You must be logged in to post a comment.