
The idea of playing with data is new to most people. This activity lets people quickly build sculptures that tell a simple data story with craft materials. The playful approach to the data helps engage the participants in thinking about how stories can be found and presented quickly, and helps people feel more freedom and flexibility about data presentations. It builds a notion of “presentation” instead of “visualization”. The activity also builds the ability to translate words and numbers into structural forms. In addition, playing with these materials at the start of a workshop can break down power dynamics that might exist within the group.
What you need:
- craft materials (plastic bottle tops, wire, fuzzy balls, colored paper, construction paper)
- tape, glue, scissors
- do NOT include pens, crayons, or anything else to write with (otherwise people just draw instead of building)
- DO NOT include LEGO bricks!!! (otherwise people just build bar charts)
How you do it:
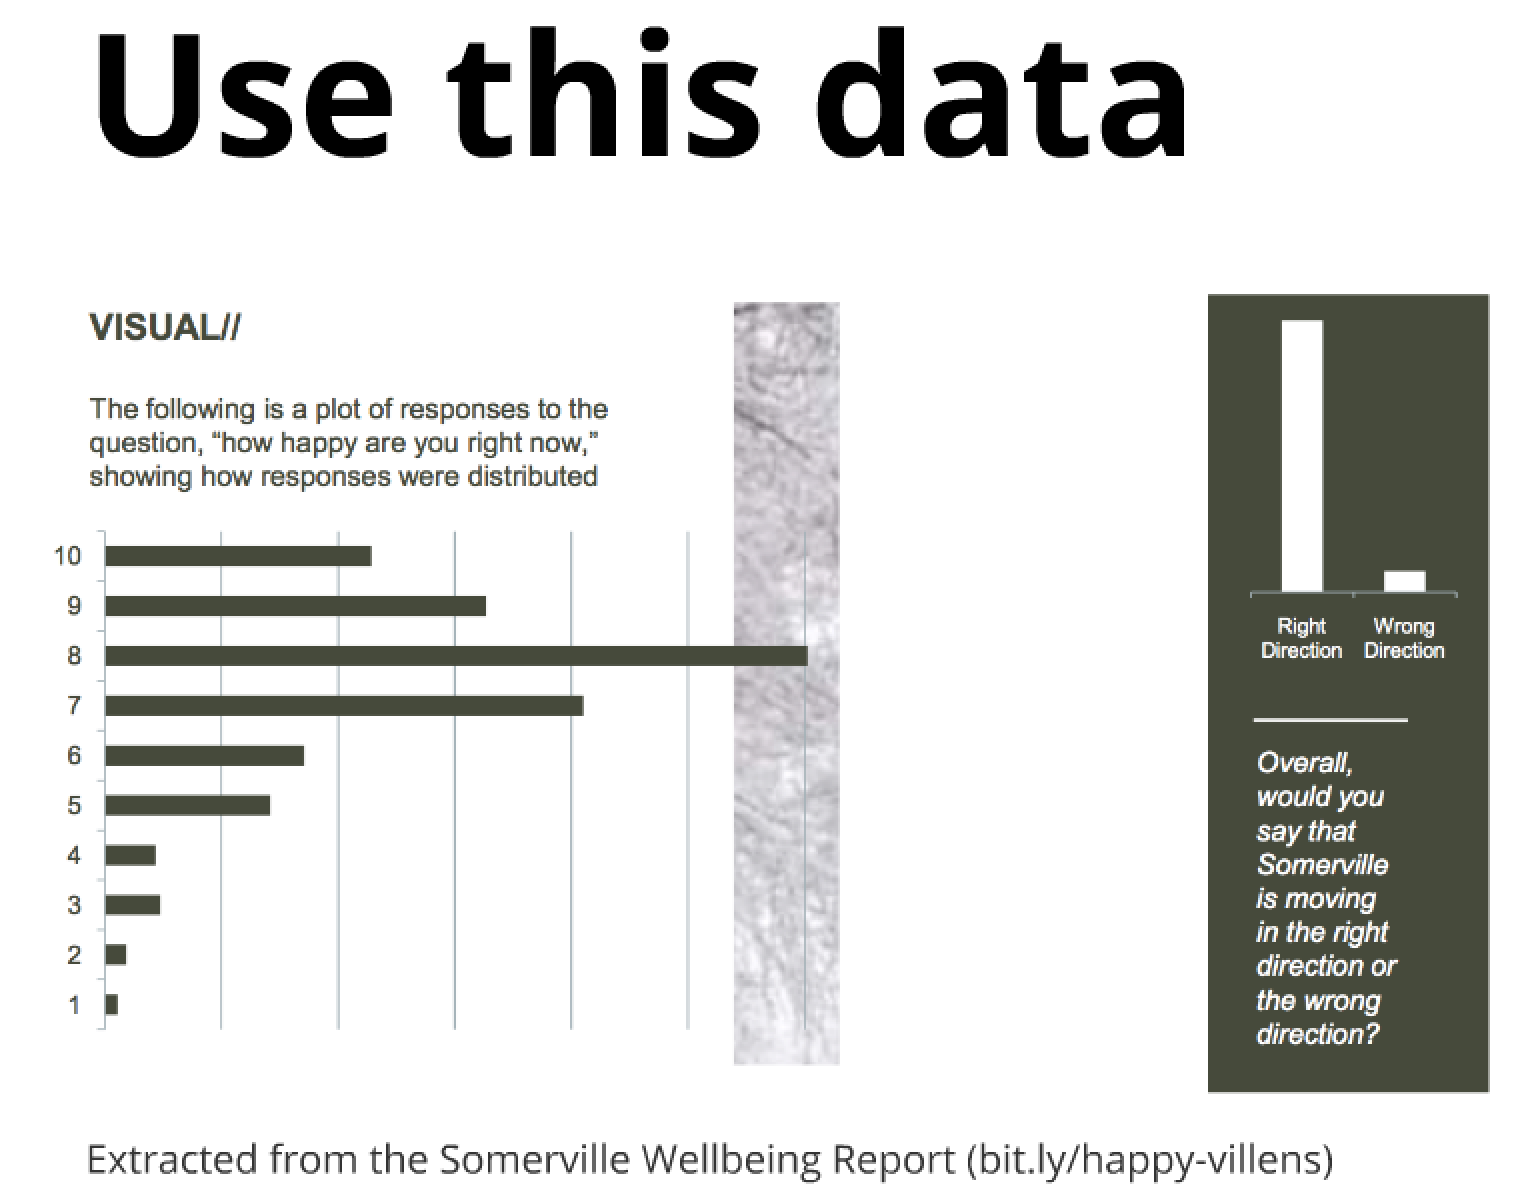
Introduce the group to two related “normal” charts of data. One can be a single fact, and the other a medium-sized set of information. We often use some fun data from the Somerville Wellbeing Survey about how happy people are:
Ask the group to pair up, preferably with someone they don’t know. Show participants a large central table full of the materials you have gathered. Give them 6 minutes to quickly build a physical representation of the data you presented earlier. Remind them they are creative, and that pipe cleaner bar charts are NOT allowed!
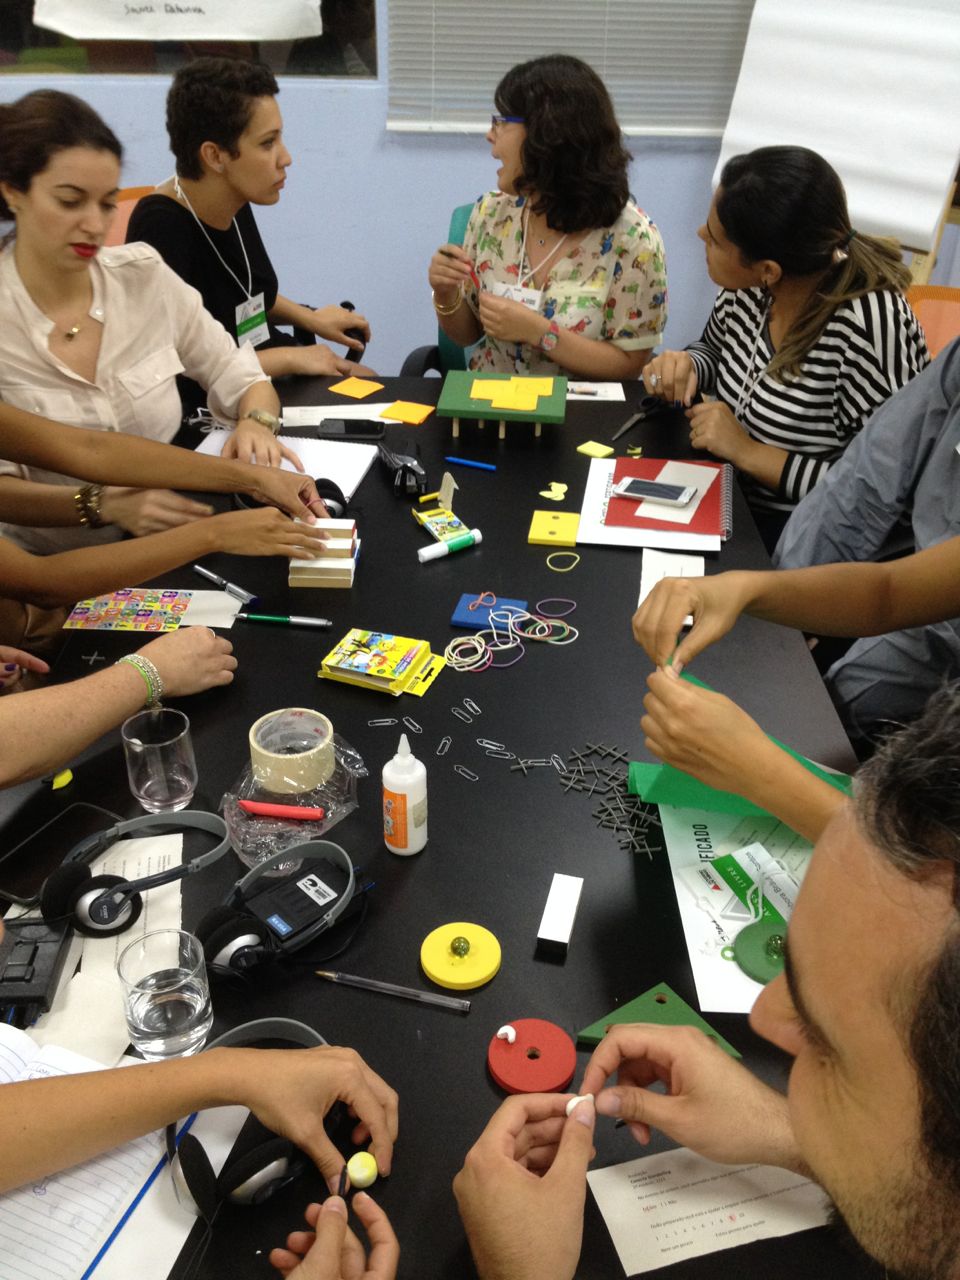
Stop everyone when the time is up. Give each group 1 minute to share what they made.
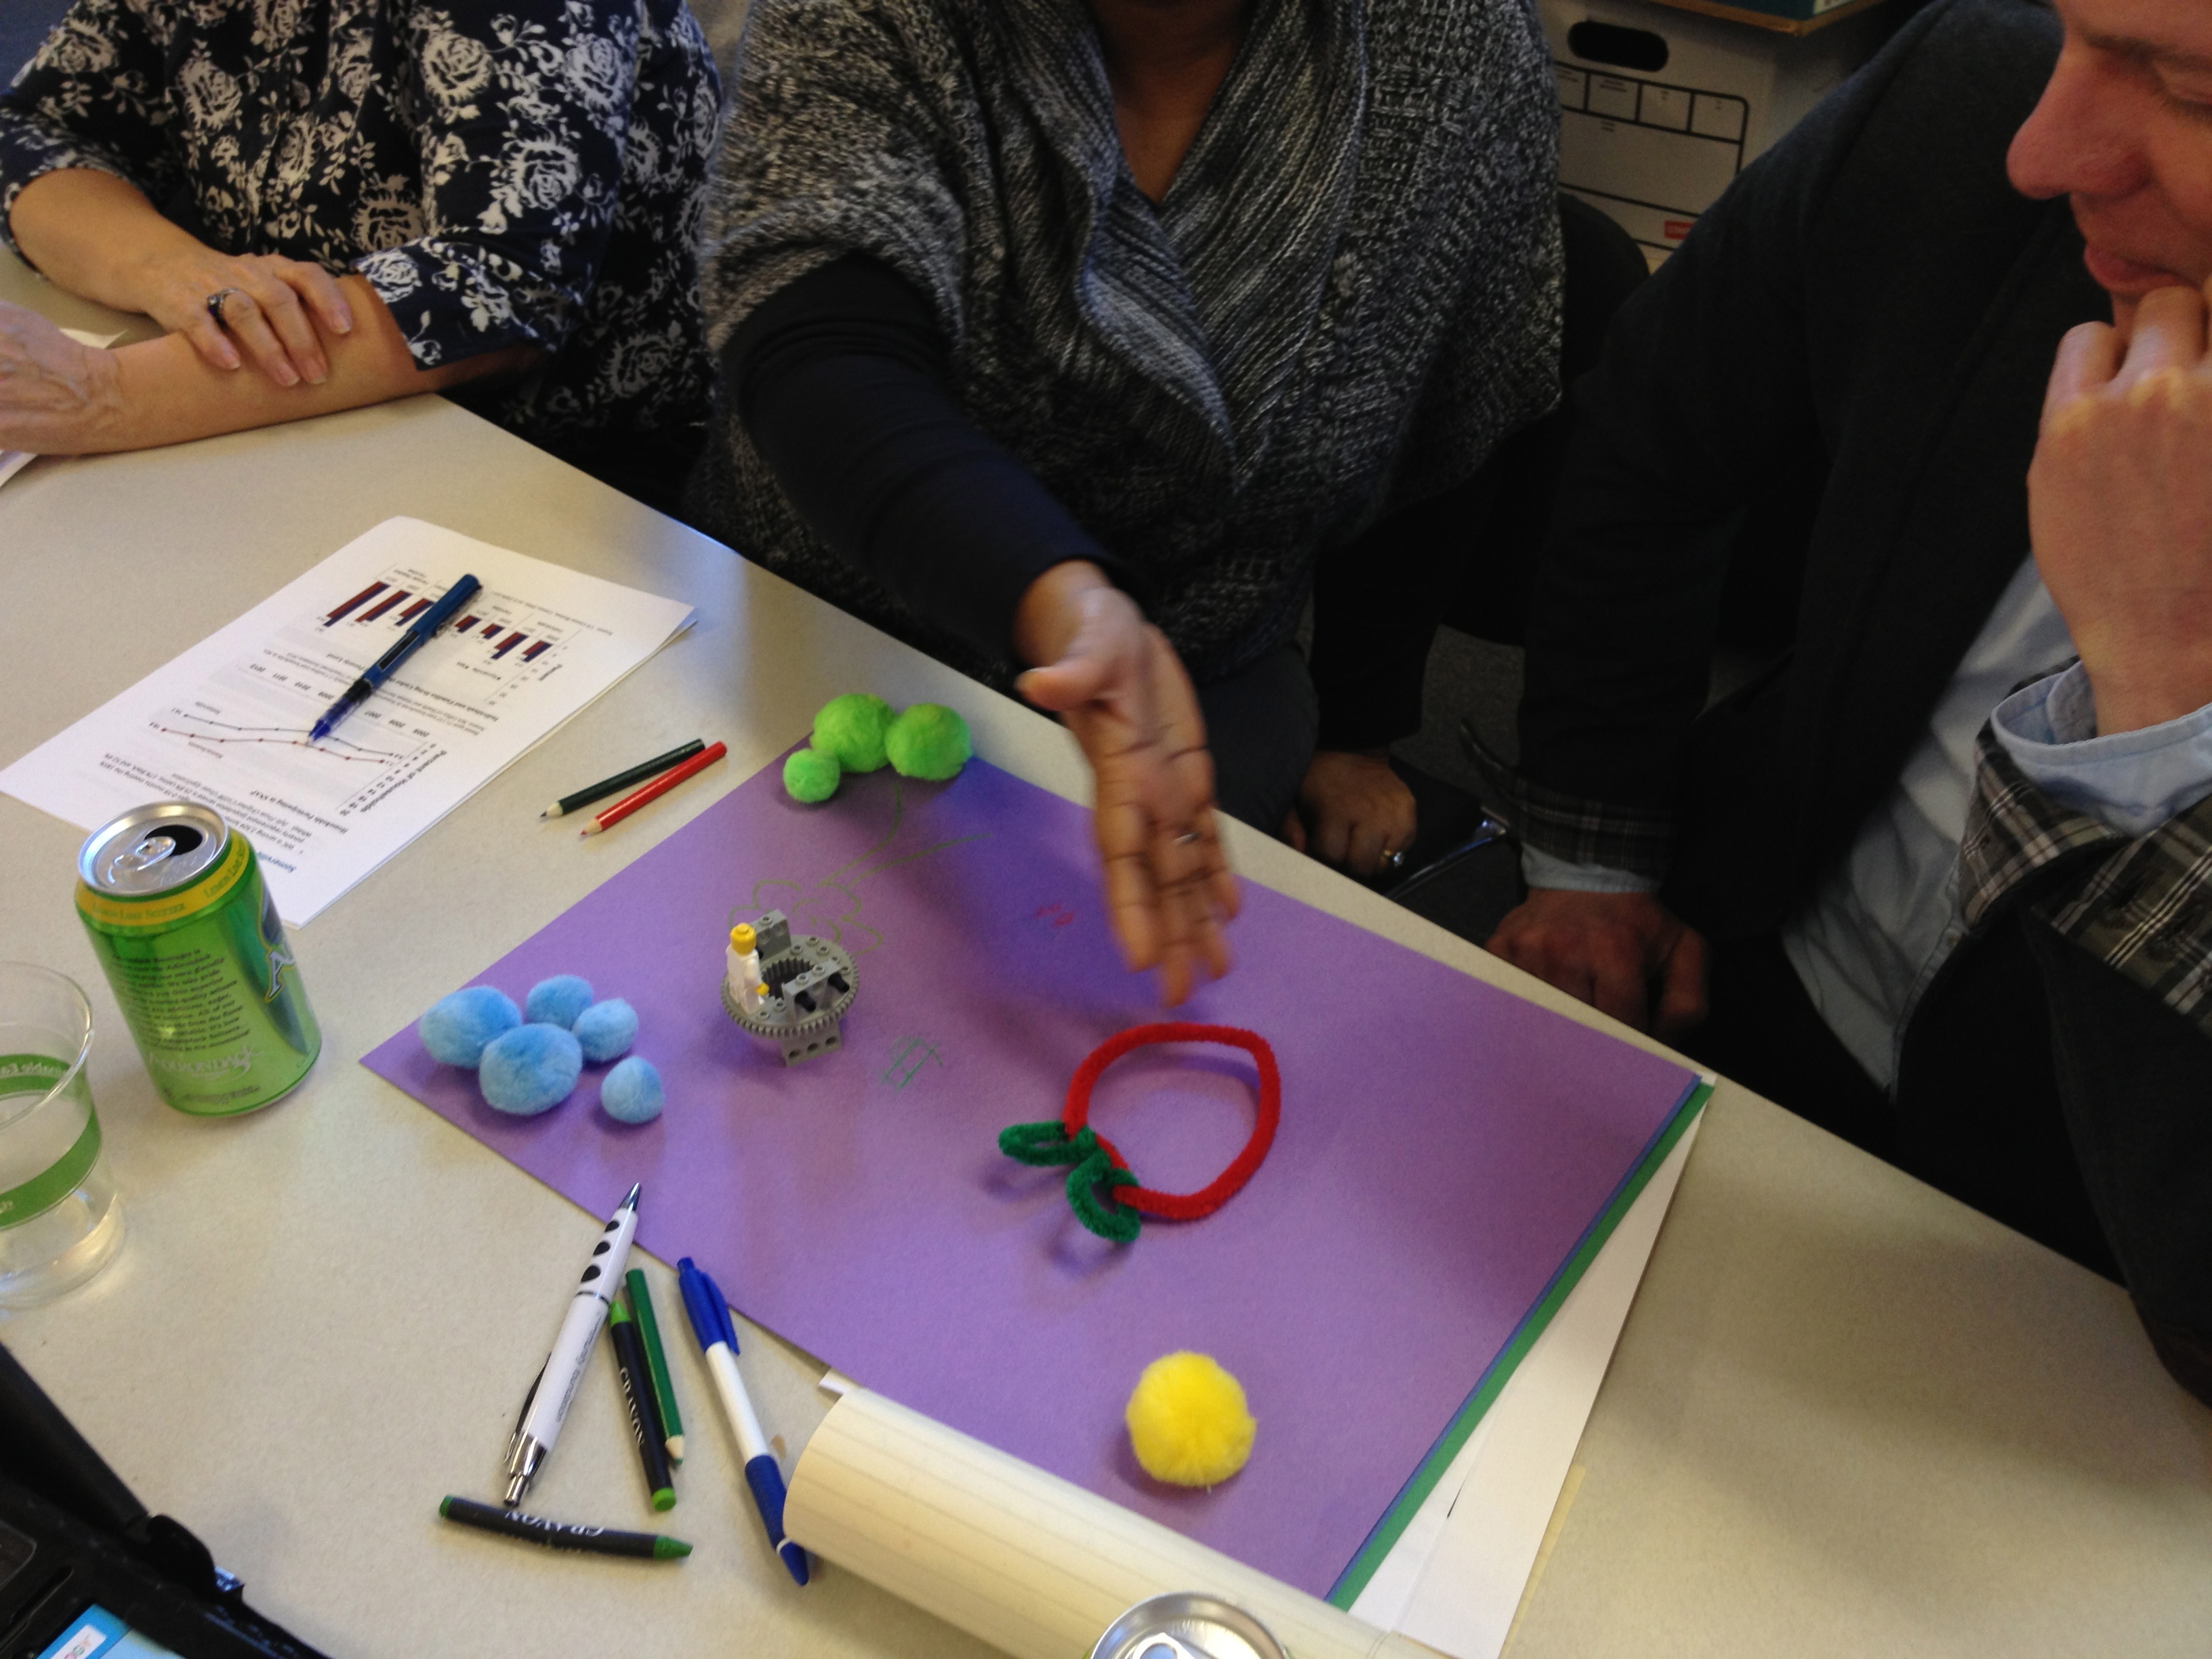
Summarize by point out similarities and differences in the pieces folks made. Often you’ll see some people focusing on one data point, while others look at a broader picture. With the happiness data, some people try to merge to two datasets, while others just focus on one. Point out any physical versions of traditional charts to point out how entrenched our current visual presentation techniques are!
Inspirations:
This activity builds on the pedagogy and workshop style of the MIT Media Lab’s Lifelong Kindergarten Group (where Rahul got his Master’s degree). It also has connections to the participatory urban planning work of James Rojas.
